Climate Coup: The Science

We checked the climate models against our best and latest data. They got all their major predictions wrong—air temperatures, oceans temperatures, atmospheric warming patterns, and outgoing radiation.

By DR. DAVID EVANS | SPPI | APRIL 23, 2012

Introduction

Our emissions of carbon dioxide cause some global warming, and it has indeed warmed over the last century. But this doesn’t prove that our emissions are the main cause of that warming—there might be other, larger, natural forces on the temperature. The key question is: how much warming do our emissions cause?

Climate scientists use their climate models to estimate how much. In this article we check their main predictions against our best and latest data, and find they got them all wrong: they exaggerated the warming of the air and oceans, they predicted a very different pattern of atmospheric warming, and they got the short-term relationship between outgoing radiation and surface warming backwards. The latter two items are especially pertinent, because they show that the crucial amplification due to the water feedbacks (mainly humidity and clouds), that is assumed by the models, does not exist in reality. This amplification causes two-thirds of the temperature rises predicted by the models, while carbon dioxide only directly causes one third. This explains why the models overestimate temperature rises.

We check the performance of the climate models against impeccably sourced, publicly available data from our best and latest instruments. See the end notes for how to download the data yourself.

Checking the Theory of Manmade Global Warming Against the Data

The theory of manmade global warming is that the world has been warming for the last few decades, that this is almost entirely due to our emissions of carbon dioxide (CO2)2, and that the warming by 2100 will be a dangerous 3–4°C.

The theory is embodied in the climate models, which are used to predict the future climate. We will now check their predictions against the best and latest global data, collected by our most sophisticated instruments. The climate models have been essentially the same for almost 30 years now, maintaining roughly the same sensitivity to extra CO2 even while they became more detailed as computer power increased. So it is fair to compare their predictions from over two decades ago with what subsequently happened.

Warning, forbidden data: The data in this article is impeccably sourced, from our best instruments, and is publicly available. Yet none of it has appeared in the mainstream media, ever, anywhere in the world. This observation leads into the political argument in Climate Coup—The Politics. As you look at the data, ask yourself whether it is relevant and whether the media should withhold it from us.

Air Temperatures

The best sources of air temperature data are the satellites. They circle the earth 24/7, measuring the air temperature above broad swathes of land and ocean, covering all of the globe except near the poles, and are unbiased. Satellite measurements started in 1979; early problems with calibration have long since been resolved to everyone’s satisfaction. The data presented here comes from NASA satellites and is managed at the University of Alabama Hunstville (UAH).6 This is an impeccable source of data, and you can easily download the data yourself. The data is currently collected from this satellite:

One of the earliest and most politically important predictions was presented to the US Congress in 1988 by Dr James Hansen, the “father of global warming”. Here are his three predicted scenarios, taken from his peer-reviewed paper in 198811 and re-graphed against what the NASA satellites subsequently measured (all starting from the same point in mid-1987):

Hansen’s climate model clearly exaggerated future temperature rises.

In particular, look at his scenario C, which is what his climate model predicted would happen if human CO2 emissions were cut back drastically starting in 1988, such that by year 2000 the CO2 level was no longer rising. In reality the temperature is below his scenario C prediction even though our CO2 emissions continued to increase—which suggests that the climate models greatly overestimate the warming effect of our CO2 emissions.

A more considered prediction by the climate models (and the earliest that cannot be wiggled out of) was made in 1990 in the IPCC’s First Assessment Report:
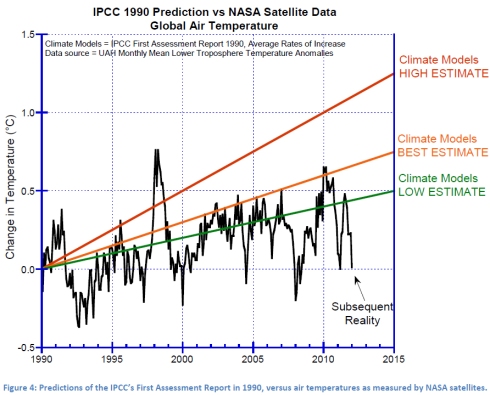
After 21 years, the real-world warming trend is below the lowest IPCC prediction.

Ocean Temperatures

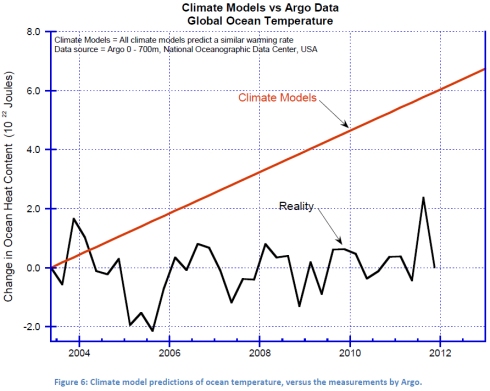
The oceans hold the vast bulk of the heat in the climate system. We’ve only been measuring ocean temperature properly since mid-2003, when the Argo system became operational.

Ocean temperature measurements before Argo are nearly worthless. They were made with buckets, or with bathythermographs (XBTs)—expendable probes that fall through the water, transmitting data back along a pair of thin wires. Nearly all measurements were from ships along the main commercial shipping lanes, so geographical coverage of the world’s oceans was very poor—for example the huge southern oceans were barely monitored. XBT data is much less precise and much less accurate than Argo data—for one thing, they move too quickly through the water to come to thermal equilibrium with the water they are trying to measure.

Argo buoys duck dive down to 2,000 meters, measuring temperatures as they slowly ascend, then radio the results back to headquarters via satellite. Over 3,000 Argo buoys constantly patrol all the oceans of the world.

The ocean heat content down to 700m as measured by Argo is now publicly available, and you can easily download the data yourself. Ocean heat content is measured in units of 1022 Joules, which corresponds to a temperature change of about 0.01°C. The climate models project ocean heat content increasing at about 0.7 × 10²² Joules per year.
The average sea level rise since 2004 is about 0.33 mm per year, or about 3.3 cm (1.3 inches) per century, which confirms the Argo message that the oceans haven’t warmed recently. In contrast, the IPCC in 2007 predicted a sea level rise of 26 to 59 cm by the end of the century if our CO2 emissions continue unabated, and Al Gore suggested in his movie that we might see a rise of 20 feet and half of Florida underwater.

Read Full Article →

50 Astronautas y Científicos de la NASA le piden que Detenga su Propaganda sobre Cambio Climático

El Calentamiento Global Antropogénico es un dogma, dicen los científicos

Lea la carta a continuación:

Lea la carta original en Inglés aquí.

28 de marzo 2012
El Honorable Charles Bolden Jr.
Administrador de la NASA
Sede de la NASA
Washington, DC 20546-0001

Nosotros, los abajo firmantes, solicitamos respetuosamente que la NASA y el Instituto Goddard de Estudios Espaciales (GISS), eviten observaciones no probadas incluyendo los informes públicos y sitios web. Creemos que las declaraciones de la NASA y GISS, que las emisiones de dióxido de carbono han tenido un impacto catastrófico sobre el cambio climático global son infundadas, sobre todo si tenemos en cuenta miles de años de datos empíricos. Con cientos de científicos del clima bien conocidos, y decenas de miles de otros científicos que declaran públicamente su falta de fe en las predicciones catastróficas, sobre todo viniendo de la dirección del GISS, es claro que la ciencia no está resuelta.

La defensa desenfrenada que el CO2 es la causa principal del cambio climático no es apropiada en la historia de la NASA, que por lo general hace una evaluación objetiva de todos los datos científicos disponibles antes de tomar decisiones o hacer declaraciones públicas.

Como ex funcionarios de la NASA, nos parece que la defensa de una posición extrema, antes de que un estudio detallado de los posibles efectos de las causas naturales del cambio climático se haga, no es apropiado. Le pedimos que evite incluir observaciones no probadas y sin apoyo en sus futuras versiones y sitios web sobre el tema. En riesgo está el daño a la reputación ejemplar de científicos de la NASA actuales o ex empleados de la NASA, e incluso la reputación de la propia ciencia.

Para obtener información adicional acerca de la ciencia detrás de nuestra preocupación, le recomendamos que entre en contacto con Harrison Schmitt y Walter Cunningham, y otros que ellos puedan recomendar a usted.

Gracias por considerar esta petición.

Atentamente,

(Firmas adjunto)

CC: Mr. John Grunsfeld, Associate Administrator for Science
CC: Ass Mr. Chris Scolese, Director, Goddard Space Flight Center

Ref: Letter to NASA Administrator Charles Bolden, dated 3-26-12, regarding a request for NASA to refrain from making unsubstantiated claims that human produced CO2 is having a catastrophic impact on climate change.

1. /s/ Jack Barneburg, Jack – JSC, Space Shuttle Structures, Engineering Directorate, 34 years
2. /s/ Larry Bell – JSC, Mgr. Crew Systems Div., Engineering Directorate, 32 years
3. /s/ Dr. Donald Bogard – JSC, Principal Investigator, Science Directorate, 41 years
4. /s/ Jerry C. Bostick – JSC, Principal Investigator, Science Directorate, 23 years
5. /s/ Dr. Phillip K. Chapman – JSC, Scientist – astronaut, 5 years
6. /s/ Michael F. Collins, JSC, Chief, Flight Design and Dynamics Division, MOD, 41 years
7. /s/ Dr. Kenneth Cox – JSC, Chief Flight Dynamics Div., Engr. Directorate, 40 years
8. /s/ Walter Cunningham – JSC, Astronaut, Apollo 7, 8 years
9. /s/ Dr. Donald M. Curry – JSC, Mgr. Shuttle Leading Edge, Thermal Protection Sys., Engr. Dir., 44 years
10. /s/ Leroy Day – Hdq. Deputy Director, Space Shuttle Program, 19 years
11. /s/ Dr. Henry P. Decell, Jr. – JSC, Chief, Theory & Analysis Office, 5 years
12. /s/Charles F. Deiterich – JSC, Mgr., Flight Operations Integration, MOD, 30 years
13. /s/ Dr. Harold Doiron – JSC, Chairman, Shuttle Pogo Prevention Panel, 16 years
14. /s/ Charles Duke – JSC, Astronaut, Apollo 16, 10 years
15. /s/ Anita Gale
16. /s/ Grace Germany – JSC, Program Analyst, 35 years
17. /s/ Ed Gibson – JSC, Astronaut Skylab 4, 14 years
18. /s/ Richard Gordon – JSC, Astronaut, Gemini Xi, Apollo 12, 9 years
19. /s/ Gerald C. Griffin – JSC, Apollo Flight Director, and Director of Johnson Space Center, 22 years
20. /s/ Thomas M. Grubbs – JSC, Chief, Aircraft Maintenance and Engineering Branch, 31 years
21. /s/ Thomas J. Harmon
22. /s/ David W. Heath – JSC, Reentry Specialist, MOD, 30 years
23. /s/ Miguel A. Hernandez, Jr. – JSC, Flight crew training and operations, 3 years
24. /s/ James R. Roundtree – JSC Branch Chief, 26 years
25. /s/ Enoch Jones – JSC, Mgr. SE&I, Shuttle Program Office, 26 years
26. /s/ Dr. Joseph Kerwin – JSC, Astronaut, Skylab 2, Director of Space and Life Sciences, 22 years
27. /s/ Jack Knight – JSC, Chief, Advanced Operations and Development Division, MOD, 40 years
28. /s/ Dr. Christopher C. Kraft – JSC, Apollo Flight Director and Director of Johnson Space Center, 24 years
29. /s/ Paul C. Kramer – JSC, Ass.t for Planning Aeroscience and Flight Mechanics Div., Egr. Dir., 34 years
30. /s/ Alex (Skip) Larsen
31. /s/ Dr. Lubert Leger – JSC, Ass’t. Chief Materials Division, Engr. Directorate, 30 years
32. /s/ Dr. Humbolt C. Mandell – JSC, Mgr. Shuttle Program Control and Advance Programs, 40 years
33. /s/ Donald K. McCutchen – JSC, Project Engineer – Space Shuttle and ISS Program Offices, 33 years
34. /s/ Thomas L. (Tom) Moser – Hdq. Dep. Assoc. Admin. & Director, Space Station Program, 28 years
35. /s/ Dr. George Mueller – Hdq., Assoc. Adm., Office of Space Flight, 6 years
36. /s/ Tom Ohesorge
37. /s/ James Peacock – JSC, Apollo and Shuttle Program Office, 21 years
38. /s/ Richard McFarland – JSC, Mgr. Motion Simulators, 28 years
39. /s/ Joseph E. Rogers – JSC, Chief, Structures and Dynamics Branch, Engr. Directorate, 40 years
40. /s/ Bernard J. Rosenbaum – JSC, Chief Engineer, Propulsion and Power Division, Engr. Dir., 48 years
41. /s/ Dr. Harrison (Jack) Schmitt – JSC, Astronaut Apollo 17, 10 years
42. /s/ Gerard C. Shows – JSC, Asst. Manager, Quality Assurance, 30 years
43. /s/ Kenneth Suit – JSC, Ass’t Mgr., Systems Integration, Space Shuttle, 37 years
44. /s/ Robert F. Thompson – JSC, Program Manager, Space Shuttle, 44 years
45. /s/ Frank Van Renesselaer – Hdq., Mgr. Shuttle Solid Rocket Boosters, 15 years
46. /s/ Dr. James Visentine – JSC Materials Branch, Engineering Directorate, 30 years
47. /s/ Manfred (Dutch) von Ehrenfried – JSC, Flight Controller; Mercury, Gemini & Apollo, MOD, 10 years
48. /s/ George Weisskopf – JSC, Avionics Systems Division, Engineering Dir., 40 years
49. /s/ Al Worden – JSC, Astronaut, Apollo 15, 9 years
50. /s/ Thomas (Tom) Wysmuller – JSC, Meteorologist, 5 years

Mad: Engineer Humans to Combat Climate Change?

by Ross Andersen
The Atlantic
March 13, 2012

The threat of global climate change has prompted us to redesign many of our technologies to be more energy-efficient. From lightweight hybrid cars to long-lasting LED’s, engineers have made well-known products smaller and less wasteful. But tinkering with our tools will only get us so far, because however smart our technologies become, the human body has its own ecological footprint, and there are more of them than ever before. So, some scholars are asking, what if we could engineer human beings to be more energy efficient? A new paper to be published in Ethics, Policy & Environment proposes a series of biomedical modifications that could help humans, themselves, consume less.
Some of the proposed modifications are simple and noninvasive. For instance, many people wish to give up meat for ecological reasons, but lack the willpower to do so on their own. The paper suggests that such individuals could take a pill that would trigger mild nausea upon the ingestion of meat, which would then lead to a lasting aversion to meat-eating. Other techniques are bound to be more controversial. For instance, the paper suggests that parents could make use of genetic engineering or hormone therapy in order to birth smaller, less resource-intensive children.
The lead author of the paper, S. Matthew Liao, is a professor of philosophy and bioethics at New York University. Liao is keen to point out that the paper is not meant to advocate for any particular human modifications, or even human engineering generally; rather, it is only meant to introduce human engineering as one possible, partial solution to climate change. He also emphasized the voluntary nature of the proposed modifications. Neither Liao or his co-authors,  Anders Sandberg and Rebecca Roache of Oxford, approve of any coercive human engineering; they favor modifications borne of individual choices, not technocratic mandates. What follows is my conversation with Liao about why he thinks human engineering could be the most ethical and effective solution to global climate change.
Judging from your paper, you seem skeptical about current efforts to mitigate climate change, including market based solutions like carbon pricing or even more radical solutions like geoengineering. Why is that?

Liao: It’s not that I don’t think that some of those solutions could succeed under the right conditions; it’s more that I think that they might turn out to be inadequate, or in some cases too risky. Take market solutions—so far it seems like it’s pretty difficult to orchestrate workable international agreements to affect international emissions trading. The Kyoto Protocol, for instance, has not produced demonstrable reductions in global emissions, and in any event demand for petrol and for electricity seems to be pretty inelastic. And so it’s questionable whether carbon taxation alone can deliver the kind of reduction that we need to really take on climate change.
With respect to geoengineering, the worry is that it’s just too risky—many of the technologies involved have never been attempted on such a large scale, and so you have to worry that by implementing these techniques we could endanger ourselves or future generations. For example it’s been suggested that we could alter the reflectivity of the atmosphere using sulfate aerosol so as to turn away a portion of the sun’s heat, but it could be that doing so would destroy the ozone layer, which would obviously be problematic. Others have argued that we ought to fertilize the ocean with iron, because doing so might encourage a massive bloom of carbon-sucking plankton. But doing so could potentially render the ocean inhospitable to fish, which would obviously also be quite problematic.
One human engineering strategy you mention is a kind of pharmacologically induced meat intolerance. You suggest that humans could be given meat alongside a medication that triggers extreme nausea, which would then cause a long-lasting aversion to meat eating. Why is it that you expect this could have such a dramatic impact on climate change?

Liao: There is a widely cited U.N. Food and Agricultural Organization report that estimates that 18% of the world’s greenhouse gas emissions and CO2 equivalents come from livestock farming, which is actually a much higher share than from transportation. More recently it’s been suggested that livestock farming accounts for as much as 51% of the world’s greenhouse gas emissions. And then there are estimates that as much as 9% of human emissions occur as a result of deforestation for the expansion of pastures for livestock. And that doesn’t even to take into account the emissions that arise from manure, or from the livestock directly. Since a large portion of these cows and other grazing animals are raised for consumption, it seems obvious that reducing the consumption of these meats could have considerable environmental benefits.
Even a minor 21% to 24% reduction in the consumption of these kinds of meats could result in the same reduction in emissions as the total localization of food production, which would mean reducing “food miles” to zero. And, I think it’s important to note that it wouldn’t necessarily need to be a pill. We have also toyed around with the idea of a patch that might stimulate the immune system to reject common bovine proteins, which could lead to a similar kind of lasting aversion to meat products.
Your paper also discusses the use of human engineering to make humans smaller. Why would this be a powerful technique in the fight against climate change?

Liao: Well one of the things that we noticed is that human ecological footprints are partly correlated with size. Each kilogram of body mass requires a certain amount of food and nutrients and so, other things being equal, the larger person is the more food and energy they are going to soak up over the course of a lifetime. There are also other, less obvious ways in which larger people consume more energy than smaller people—for example a car uses more fuel per mile to carry a heavier person, more fabric is needed to clothe larger people, and heavier people wear out shoes, carpets and furniture at a quicker rate than lighter people, and so on.
And so size reduction could be one way to reduce a person’s ecological footprint. For instance if you reduce the average U.S. height by just 15cm, you could reduce body mass by 21% for men and 25% for women, with a corresponding reduction in metabolic rates by some 15% to 18%, because less tissue means lower energy and nutrient needs.
Read Full Article →

Australia Officially Under Carbon Tax Tyranny

According to Australian Prime Minister Julia Gillard - who came into office swearing there would not be a tax on carbon emissions – expected consequences include higher prices for consumers and a price tab for industries of more than $380 million annually.

AFP
November 8, 2011

Australia’s parliament approved a controversial pollution tax on Tuesday, after years of bitter debate over the reform which is aimed at lowering carbon emissions blamed for climate change.

Cheers and applause broke out as the upper house Senate passed the Clean Energy Act, requiring Australia’s coal-fired power stations and other major emitters to “pay to pollute” from July 1 next year.

Prime Minister Julia Gillard said it was the culmination of a “quarter of a century of scientific warnings, 37 parliamentary inquiries and years of bitter debate and division.”

“Today Australia has a price on carbon as the law of our land,” she said as the tax, which scraped through the lower house last month, was approved by the Senate in a 36-32 vote.

“Today we have made history — after all of these days of debate and division, our nation has got the job done.”

Gillard said the scheme — which will levy a price of Aus$23 (US$23.80) per tonne on carbon pollution before moving to an emissions trading scheme in 2015 — would begin to address “the devastating impacts of climate change”.

She said the reforms, which include investments in renewable energy sources, would result in Australia cutting its carbon emissions by 160 million tonnes in 2020 — equivalent to taking 45 million cars off the road.

The government hopes the levy will create economic incentives for the biggest polluters to reduce their emissions but acknowledges that businesses will factor the carbon price into the cost of their goods and services.

To offset this, much of the revenue raised from the tax in the first three years will provide for higher family payments, pension boosts and income tax cuts to help pay for the higher cost of living.

Only New Zealand and the European Union have taken comparable economy-wide action by introducing cap-and-trade schemes, and the tax will put mining-driven Australia at the forefront of efforts in the Asia-Pacific.

“This is a big achievement, coming at an opportune time,” said Professor John Quiggin, an economics and tax specialist from the University of Queensland.

“With South Korea planning to follow suit, momentum towards carbon emission reductions in the Asia Pacific is starting to build.”

Tuesday’s senate vote caps a tumultuous period in Australian politics, largely centred on how the vast nation, which is among the world’s worst per capita polluters, should tackle carbon emissions linked to global warming.

Former prime minister Kevin Rudd harnessed an unprecedented wave of popular support for climate change action in 2007, winning elections in a landslide after campaigning to ratify the Kyoto Protocol and take other green measures.

But his plans were frustrated by entrenched conservative opposition which led to him shelving a proposed emissions trading scheme, damaging his credibility. He was ousted by Gillard in a Labor party-room coup in 2010.

Gillard went to the subsequent election promising there would be no carbon tax, but later backflipped, saying it was a necessary first step towards a flexible carbon pricing scheme.

Australia is heavily reliant on its coal exports, and thousands have rallied against the levy which they argue will raise living costs, cut jobs and ultimately prove ineffective.

Industry associations says Australia’s scheme is punitive and priced far higher than the European Union system.

Earlier media projections indicated that mining giants BHP Billiton, Rio Tinto and Xstrata would be liable for a combined $380 million annually at an earlier price of $20 a tonne.

Elsewhere in Asia, South Korea is pursuing a “cap without trade” scheme involving some 450 companies from next year in preparation for a full emissions trading scheme (ETS) from January 2015, but Japan shelved national ETS plans late last year.

China is considering a pilot ETS programme in some provinces and while there are sub-national schemes in some parts of North America no broad-scale action has been taken in the United States.

The timing of the vote is significant, representing a firm commitment ahead of high-level UN climate talks in South Africa later this month that are being called a “make or break” meeting for legally binding carbon emission reduction targets.

Another Climategate? This time from BEST

BEST study confirms global temperature standstill, but the organization’s head climatologist, Professor Richard Muller, says measurements for the last decade were not included in the study’s results.

by Dr. David Whitehouse
The Observatory
November 1, 2011

Contrary to claims being made by the leader of the Best global temperature initiative their data confirms, and places on a firmer statistical basis, the global temperature standstill of the past ten years as seen by other groups.

Many people have now had some time to read the papers issued in preprint form from the Best project. My strong impression is that they are mostly poorly written, badly argued and at this stage unfit for submission to a major journal. Whilst I have made some comments about Best’s PR and data release strategy, I want to now look at some aspects of the data.

When asked by the BBC’s Today programme Professor Richard Muller, leader of the initiative, said that the global temperature standstill of the past decade was not present in their data.

“In our data, which is only on the land we see no evidence of it having slowed down. Now the evidence which shows that it has been stopped is a combination of land and ocean data. The oceans do not heat as much as the land because it absorbs more of the heat and when the data are combined with the land data then the other groups have shown that when it does seem to be leveling off. We have not seen that in the land data.”

My first though would be that it would be remarkable if it was. The global temperature standstill of the past decade is obvious in HadCrut3 data which is a combination of land and sea surface data. Best is only land data from nearly 40,000 weather stations. Professor Muller says they “really get a good coverage of the globe.” The land is expected to have a fast response to the warming of the lower atmosphere caused by greenhouse gas forcing, unlike the oceans with their high thermal capacity and their decadal timescales for heating and cooling, though not forgetting the ENSO and la Nina.

Fig 1 shows the past ten years plotted from the monthly data from Best’s archives. Click on the image to enlarge.

BestMonthly

It is a statistically perfect straight line of zero gradient. Indeed, most of the largest variations in it can be attributed to ENSO and la Nina effects. It is impossible to reconcile this with Professor Muller’s statement. Could it really be the case that Professor Muller has not looked at the data in an appropriate way to see the last ten years clearly?

(Incidently you could extend the graph back a few years before 2001 and it doesn’t make much difference because the ‘super el nino’ of 1998 and the two subsequent cooler years of 1999 and 2000 do not show up as dramatically in the Best land data as they do in HadCrut3. I would also point out that there is now an abundance of peer-reviewed literature that deals with the question of the lack of temperature increase in the past decade, so our graph’s starting point and duration is justifiable. Arguments that the time period we chose was cherry-picked to show a flat line, and that slightly longer periods would not, are incorrect. There are, of course, still those who distort the argument by saying that ten years is too short for climatic conclusions, as if ten years of data is meaningless. Also Professor Muller was asked a specific question about the last ten years, and our graph is a response to his specific answer.)

Indeed Best seems to have worked hard to obscure the past decade. They present data covering more almost 200 years is presented with a short x-axis and a stretched y-axis to accentuate the increase. The data is then smoothed using a ten year average which is ideally suited to removing the past five years of the past decade and mix the earlier standstill years with years when there was an increase. This is an ideal formula for suppressing the past decade’s data.

When examined more objectively Best data confirms the global temperature standstill of the past decade. That the standstill should be present in land only data is remarkable. There have been standstills in land temperature before, but the significance of the past decade is that it is in the era of mankind’s postulated influence on climate through greenhouse gas forcing. Predictions made many times in the past few years suggest that warming should be the strongest and fastest in the land data.

Only a few years ago many scientists and commentators would not acknowledge the global temperature standstill of the past decade. Now that it has become unarguable there has emerged more explanations for it than can possibly be the case.

To explain the combined sea-land temperature hiatus some have suggested that the oceans are sucking up the heat, as professor Muller outlines in his radio interview. This explanation is strained in my view if the land temperature stays constant. Could we really have the very special situation whereby the oceans sequester just enough heat at just the right time to keep the land temperature flat? Aerosols, postulated by some to be coming from China, don’t provide an explanation for the land temperature hiatus either. In fact, the constant land temperature puts a strain on all of the explanations offered for why the land-sea combination hasn’t warmed in the past decade or so.

We make a big deal of the temperature going up. In my view we should make a bigger scientific deal about temperature flatlining for a decade or more in the face of rising CO2 levels. If further scrutiny of the Best dataset confirms this finding we will have new questions about the nature and balance of oceanic and land warming.

The fact that Best confirms the global temperature hiatus and shows that it is apparent in land only data is significant, and in my view its major scientific finding, so far. It is puzzling that they missed it.

Daftar Akun Bandar Togel Resmi dengan Hadiah 4D 10 Juta Tahun 2024

Togel resmi adalah langkah penting bagi para penggemar togel yang ingin menikmati permainan dengan aman dan terpercaya. Tahun 2024 menawarkan berbagai kesempatan menarik, termasuk hadiah 4D sebesar 10 juta rupiah yang bisa Anda menangkan. Anda perlu mendaftar akun di Daftar Togel yang menawarkan hadiah tersebut. Proses pendaftaran biasanya sederhana dan melibatkan pengisian formulir dengan informasi pribadi Anda serta verifikasi data untuk memastikan keamanan transaksi. Setelah akun Anda selasai terdaftar, Anda dapat berpartisipasi dalam berbagai permainan togel berbagai fitur yang disediakan oleh situs togel terbesar.

Related Links:

Togel178

Pedetogel

Sabatoto

Togel279

Togel158

Colok178

Novaslot88

Lain-Lain

Partner Links