Manipulated Markets Make a Come Back

Does it make sense that during the deepest depression since 1929, the U.S. Stock Market comes back up from a 6oo+ point decline? Only a manipulated system where speculators have complete control could recover from a rout that showed how little confidence investors have in the market today.

by Luis R. Miranda
The Real Agenda
August 9, 2011

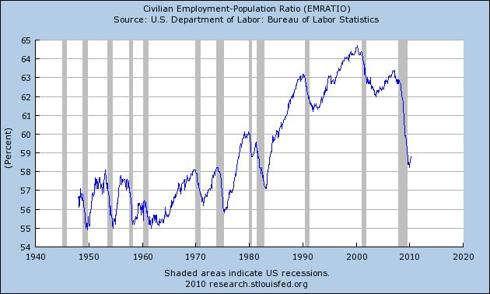
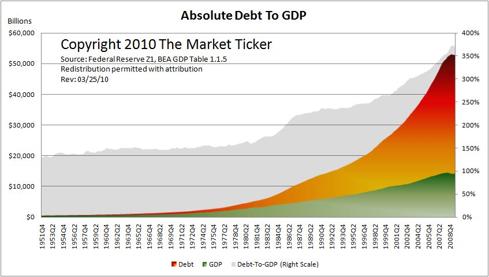
While countries are in dire straits to make payments on mostly illegally acquired debts and the price of oil continues to fall; while little to nothing is produced or manufactured in the industrialized world and no ingenuity makes it big anywhere in the world; while the most important currencies continue to tumble and other financial markets turn more sour; while unemployment continues to grow from the low 20′s and more people make use of food stamps and unemployment benefits; while more jobs are exported to third world nations that support slave work for their populations and inflation is only tamed by artificial manipulation of the currencies; while numerous people look to gold and silver as their salvation, surprisingly the stock market came back from the pantheon and surged to recover from the slide seen just a few hours ago.

There is very little that can't be done when someone or something controls fiat currencies, rating agencies, and financial markets.

But not only did the stocks came back strong; they had the largest gains in more than two years. Along with this “come back” the U.S. dollar got weaker and the Swiss franc rose the most since 1971. Even the very same Standard & Poor Index managed to recover almost 5 percent, the most significant gains since 2009. In the meantime, the origin of the financial disaster, the privately owned banks headed by the Federal Reserve announced their intent to print more worthless money into the economy as a way to “boost” confidence. Even though QE1 and QE2 failed to provide any confidence, or for that matter failed to provide anything positive, the FED believes it is appropriate to bring up QE3. With this, the FED shows its interest to purchase more government bonds, which will consolidate its position as the largest holder of U.S. government debt.

“The Fed is clearly setting up a situation that could offer them the potential to do something significant, if necessary,” Bruce McCain, who helps oversee $22 billion as chief investment strategist at the private-banking unit of KeyCorp in Cleveland, said in a telephone interview. “That could be viewed as a positive,” added McCain. “People are starting to realize that what we’ve had in the market was an overreaction.” Really? Positive? How so?

Artificial Surge after the Decline

How can a stock market come back from a 600+ point decline in just a few hours if one considers that the cause of such loss -the downgrade of the U.S. debt rating- has not been dealt with? It simply boggles the mind, doesn’t it? The United States credit rating was lowered from AAA to AA+ by Standard & Poors, a rating agency that is paid by the banks to evaluate financial products and which is in part responsible for the current financial catastrophe. Together with Moody’s, S&P was created the by the banking system to carry out “independent” evaluations of financial products as well as credit confidence on institutions, state and local governments and of course whole nations.

According to Bloomberg, Stocks came back from a loss of $ 1 trillion after S&P downgraded the U.S. credit rating last Friday evening. The results of the downgrade were not felt until Monday, when the Markets opened all over the world. The S&P index sank about 11 percent and the stock market lost 648 points or more than 6 percent. But just 24 hours later, everything was different. “The MSCI All-Country World Index rose 2.1 percent for its biggest gain of the year”, says Bloomberg. “The index started the U.S. session valued at about 12.1 times profits, down from 21 in 1995..The MSCI Emerging Markets Index pared today’s drop to 2.2 percent after tumbling as much as 4.4 percent.”

Stocks Rally? What Rally?

In the Stock Market, the Dow Jones climbed almost 430 or 4 percent, failing to completely recover from the recent loss. The stocks experienced the 1oth more significant gain in its history. Can you believe it? In the middle of a Depression, the stocks rally the much?

Meanwhile, in the S&P, shares got to the front of the line due to the numerically significant gains. In total, they accumulated some 8.2 percent all together. This is the biggest rally since May 2009, which meant a complete recovery from Monday’s low. Bank of America Corp., which is now being sued by AIG for fraud, managed to gain 17 percent while other players like Hartford Financial Services got back 16 percent.

Of course the main stream media is giving all credit to the Federal Reserve, due to its announcement that it intends to “boost” the economy by injecting worthless cash into it. The FED’s head, Ben Bernanke and his aides came out to try to calm the demise a bit, although not everyone at the FED agreed with the move to bring along a new quantitative easing move. Three members from the policy committee dissented and instead called for maintaining interest rates low for a longer period of time.

As the docu-film “The Inside Job” impeccably exposes, there is very little that can’t be done when someone or something has the power to create money out of thin air, create rating agencies, control those agencies to give AAA ratings to whatever they choose and electronically manipulate the financial stock and bond markets whenever it’s convenient in order to perpetuate the fraudulent debt-based system the world has worked under since 1913.

False Policy Changes

The best way to perpetuate the above cited financial system is to have the available tool continuously reinforce the falsehood of the Central Bank sponsored plans. So, Moody’s has come out to praise the FED’s move to maintain the interest rates at a quarter of a percent in order to bolster the downturn. It’s a  ”major policy change,” said Augustine Faucher, director of macroeconomics at Moody’s. “By providing a more explicit time line for raising rates, the Fed is telling markets it is concerned about recent economic weakness and the potential for a near-term contraction, and is dedicated to spurring stronger economic growth,” Faucher added.

Just as this statement by Faucher is baseless, so is the belief that because the U.S. dollar is the world’s reserve currency, it can stand more beating than any other one. In fact, one of the reasons why the U.S. has not been downgraded further is that its currency is still consider valuable. Ironically, the dollar has lost 98 percent of its value since it became the subject of manipulation by the bankers. Moody’s has stated that the U.S. dollar can support larger levels of debt than other currencies. How do they figure that with a currency that is so devalued. They can’t figure it out. They just make it up.

The one world reserve currency scheme is only beneficial to those who control it, because the rest of the nations need to do business while devaluing their own. In sound economics, the value of paper money is based on a country’s production or manufacturing, therefore, the U.S. dollar can no longer be such reserve currency. U.S. manufacturing has eroded so badly, that it has cost the jobs of some 18 million people in the last few years.

If the U.S. dollar is still the world’s reserve currency, why are there other currencies that have better exchange rates than the dollar itself? I am no economic expert, but if the Swiss Frank rates higher than the dollar in currency exchange markets, shouldn’t the Frank be the reserve currency? Or even better, shouldn’t a commodity like gold be the reserve currency given its capacity to withstand recessions, depressions and financial market manipulations? It should. The reason why gold is not the reserve currency or at least the commodity over which a paper money currency is supported is that bankers cannot monopolize it, “hug” it or manipulate it.

High Market but Low Results: The World Economy in Shambles

While the banks try to extend the suffering period for the middle and low classes, countries in Europe are scrambling for a life boat to jump on. Although France and Germany are said to be negotiating an agreement to buy Spain’s and Italy’s debt in order to avoid a deeper economic collapse, some sources claim that the rescuers believe the Italian debt is too large to save. Both Nicolas Sarkozy and Angela Merkel began to hear opposition voices that are calling for a different position from the German and French governments. The reason for this is that an eventual bailout of Italy and Spain could cost the rescuers their AAA rating. This is seen as a possible trigger to drag the world’s economy further into the precipice.

Although U.S. markets artificially revived themselves on Tuesday, other countries were not as lucky. In Italy, the bond market saw a loss of 11 percent on its 10 year note. Just as the FED has done in the United States, the European Central Bank kept Italy and Spain afloat through the purchase of their bonds for a second day in a row. That was not enough to save the Spanish 10 year notes, as they collapsed eight basis points to 5.08 percent on Tuesday.

Meanwhile, oil prices hit some of the lowest levels for the year by getting down to $79.30 a barrel. Conversely, gold prices soared and added 4.1 percent to get to a record price of $1,782.50 an ounce.

The Cycle of Debt Deflation

Before It’s News

One of the most famous quotations of Austrian economist Ludwig von Mises is that “There is no means of avoiding the final collapse of a boom brought about by credit expansion. The alternative is only whether the crisis should come sooner as the result of a voluntary abandonment of further credit expansion or later as a final and total catastrophe of the currency involved.” In fact, the US economy is in a downward spiral of debt deflation despite the bold actions of the federal government and of the US Federal Reserve taken in response to the financial crisis that began in 2008 and the associated recession. Although the vicious circle of debt deflation is not widely recognized, precisely what von Mises described is happening before our eyes.

A variety of positive economic data has been reported in recent months. Retail sales rose 0.4% in April 2010 as consumer spending rose and the US gross domestic product (GDP) grew at a rate of 3%.  In May 2010, home sales rose to a five-month high and consumer confidence rose 17% (from 57.7 to 63.3). Industrial production rose 0.8% and durable goods orders rose 2.9%, more than had been forecast. However, the modest gains reported represent the continuing adaptation of economic activity at dramatically lower levels compared to the pre-recession period and most of the reported gains have been substantially manufactured by massive government deficit spending.

Despite the widely reported green shoots, in May, the unemployment rate rose to 9.9% while paychecks in the private sector shrank to historic lows as a percentage of personal income, and personal bankruptcies rose. Roughly 14% of US mortgages are delinquent or in foreclosure, credit card defaults are rising and consumer spending hit 7 month lows. To make matters worse, the reported increase in consumer credit, in fact, points to a further deterioration because consumers appear to be borrowing to service existing debt. Outside of the federal government, which is borrowing at record levels and expanding as a percentage of GDP, and outside of the bailed out financial sector, debt deflation has continued unabated since 2008.

Money Supply vs. Debt Service

A contraction of the broad money supply is taking place because the influx of money into the US economy, i.e., lending to consumers and non financial businesses, has fallen below the rate at which money is flowing out of general circulation as a function of debt service (interest and principle payments on existing debt), thus a net drain of money from the broad US economy is taking place. As a result, additional borrowing, as consumer spending falls, appears to be servicing existing debt in a pattern that is clearly unsustainable and that signals a further rise in debt defaults in coming months.
M3
Chart courtesy of Shadow Government Statistics
The estimate of the broad money supply (the Federal Reserve’s M3 monetary aggregate) is crashing and the Federal Reserve’s M1 Money Multiplier, a measure of how much new money is created through lending activity, fell off of a cliff in 2008, and remains practically flat-lined.
MULT
Chart courtesy of the Federal Reserve Bank of St. Louis
The contraction of the broad money supply points to a potential slowing of economic activity and indicates that consumers and non financial businesses will be less able to service existing debt. Despite easing somewhat in March 2010, credit card losses are expected to remain near 10% over the next year and mortgage delinquencies, are currently at a record highs, and these dismal predictions implicitly assume a stable or growing money supply.

A tsunami of eventual mortgage defaults seems to be building and loan modifications have been a failure thus far. There have been only a small number of permanent loan modifications (295,348) under the Home Affordable Modification Program (HAMP) in 2009, out of 3.3 million eligible (60 days delinquent) loans and more than half of modified loans default.

Mortgage Delinquencies and Foreclosures
Chart courtesy of Calculated Risk
Although it has been reported that American consumers are saving at a rate of 3.4%, the contraction of the broad money supply suggests savings liquidation. Given a contracting money supply, ongoing debt defaults and declining consumer spending, the increase in non-mortgage consumer loans indicates that consumers are borrowing where possible to consolidate debts, cover debt service, or borrowing to continue operating financially as their total debt grows, thus as they approach insolvency.
CONSUMER
Chart courtesy of the Federal Reserve Bank of St. Louis
The increase in non-mortgage consumer loans has not prevented an overall decline in total household debt attributed to ongoing deleveraging by consumers. While deleveraging (paying down debt) has been interpreted as caution on the part of consumers, or as low consumer confidence, the decline in outstanding credit reflects a reduced ability to borrow, i.e., to service additional debt. This suggests that the recovery of the US economy may be illusory and that the economy is likely to contract further in coming months.
CMDEBT
Chart courtesy of the Federal Reserve Bank of St. Louis
Commercial borrowing has declined more sharply than household debt suggesting that the nominal return to growth estimated at 3% has not been matched by debt financed expansion in the private sector.
BUSLOANS
Chart courtesy of the Federal Reserve Bank of St. Louis
The broad US money supply is no longer being maintained or expanded by normal lending activity. If federal government deficit spending ($1.5 trillion annually), debt monetization and emergency actions by the Federal Reserve (totaling an estimated $1.5 trillion since 2008) to recapitalize banks are considered separately, there remains a net drain effect on the broad money supply. The scarcity of money hampers economic activity, i.e., money is less available for investment, and directly exacerbates debt defaults as consumers and businesses experience cash shortfalls, while at the same time being less able to borrow. Since unemployment is a key indicator of recession, then if the US economy were contracting, it would be evident in unemployment statistics.

Structural Unemployment

Unemployment and labor force data suggest that the US labor market is in a structural decline, i.e., millions of jobs have been and are being permanently eliminated, perhaps as a long term consequence of off-shoring, outsourcing to other countries and the ongoing de-industrialization of the United States. However, the immediate meaning of the term “structural” has to with the fact that jobs created or sustained during the unprecedented expansion of debt leading to the financial crisis that began in 2008, e.g., a substantial portion of service sector jobs created in the past two decades now appear not to be viable outside of a credit expansion.

Officially, the US unemployment rate rose to 9.9% in April 2010, which represents the percentage of workers claiming unemployment benefits. However, the total number of unemployed or underemployed persons, including so-called “discouraged workers” (Bureau of Labor Statistics U-6), rose to 17.1%. Using the same methods that the BLS had used prior to the Clinton administration, U-6 would be approximately 22%, rather than the official 17.1% statistic.

U-6 Unemployment
Chart courtesy of Shadow Government Statistics
With official U-6 unemployment of 17.1% and a workforce of 154.1 million there are roughly 26,197,000 people officially out of work. Using the pre-Clinton U-6 unemployment calculation of approximately 22%, there would be 33.9 million unemployed. If the average US household consists of 2.6 persons and if 33% of the unemployed are sole wage earners, then 55.5 million US citizens currently have no means of financial support (17.9% of the population).
Unemployment by Duration
Chart courtesy of Calculated Risk
While it has been reported that the labor force is shrinking, the characterization of workers permanently exiting the workforce by choice may be inaccurate. While a shrinking workforce could reflect demographic changes, the rate of change suggests that tens of millions of Americans are simply unemployed.
EMRATIO
Chart courtesy of the Federal Reserve Bank of St. Louis
Setting aside the question of whether or not those “not in the workforce” are, in fact, permanently unemployed, the workforce, as a percentage of the total US population, is currently at 1970s levels. Since many more households today depend on two incomes to meet their obligations, compared to the 1970s, a marked drop in the percentage of the population in the workforce points to a decline in the labor market more significant than official unemployment statistics suggest. What is more important, however, is that structural unemployment suggests structural government deficits, e.g., unemployment benefits, welfare, food stamps, etc. Since more than 2/3 of US GDP (roughly 70%) consists of consumer spending, a sustainable recovery from recession seems improbable if unemployment is worsening or if the labor force is in a structural decline, since that would imply unsustainable government deficits, whether or not they are masked by nominal GDP gains thanks to economic stimulus measures.

Government and GDP Growth

The US federal government is a growing portion of GDP, thus reported GDP growth is largely a byproduct of government deficit spending and stimulus measures, i.e., reported GDP growth is unsustainable. Total government spending at the local, state and federal levels accounts for as much as 45% of GDP, thus nominal gains would be expected when government deficit spending increases. According to some measures, reported gains in GDP are a byproduct of relatively new statistical methods and, using earlier methods of calculation, GDP remains negative.
GDP
Chart courtesy of Shadow Government Statistics
Government borrowing and spending may have offset declines in the private sector but only to a degree and only temporarily. The resulting growth in US public debt has an eventual mathematical limit: insolvency. Of course, the actual limit to US borrowing remains unknown. The continuing solvency of the US depends on the ability and willingness of governments, banks and investors around the world to lend to the US, which in turn depends on the tolerance of lenders for the US government’s profligacy and money printing by the Federal Reserve, e.g., quantitative easing and exchanging new cash for worthless bank assets. US Treasury bond auctions will fail if lenders conclude that a sufficiently large portion of their investment will be diluted into oblivion by proverbial money printing. In that event, the US dollar will surely plummet, despite deflationary pressures within the domestic US economy, and the cost of foreign goods, e.g., oil, will rise causing high inflation or triggering hyperinflation.
GFDEBTN
Chart courtesy of the Federal Reserve Bank of St. Louis
According to the Bank for International Settlements (BIS), the federal budget deficit increased from 3.1% of GDP in 2007 to 9.2% in 2010.  Rather than being the result of one-time expenses, such as temporary stimulus measures, much of the deficit represents permanent increases in government spending, e.g., due to the growing number of federal employees. If increased government spending is removed, GDP appears to be declining significantly.
GDP Minus Government Deficit Spending
Chart courtesy of Karl Denninger
Of course, sustainability has more to do with total debt than with deficit spending because a deficit assumes that there is an underlying capacity to service additional debt.

Unsustainable Debt

While asset prices have declined, e.g., real estate and equities, debt levels have remained high due to the federal government’s policy of preserving bank balance sheets, which had ballooned prior to the financial crisis to the point that overall debt in the US economy reached unsustainable levels.
Total Debt to GDP
Chart courtesy of Karl Denninger
The absolute debt to GDP ratio of the US economy peaked in 2007 when debt levels exceeded the ability of the economy to service debt from income based on production, even at low interest rates. Although US GDP began to decline prior to the advent of the global financial crisis, debt coverage had been in decline approximately since the 1970s, coincidentally, around the time that the US dollar was decoupled from gold.
Declining Debt Coverage from 1971 on
Chart courtesy of Karl Denninger
Government deficit spending cannot correct the situation because, for every dollar of new borrowing, the gain in GDP is negligible and some have argued that the US economy has passed the point of “debt saturation.”
Debt Saturation
Chart courtesy of Nathan A. Martin
In a growing economy, additional debt can result in a net gain in GDP because the money supply grows and economic activity is stimulated by transactions that flow through the economy as a result. The debt saturation hypothesis is that, as debt levels rise, additional debt has less impact on GDP until a point is reached where new debt causes GDP to decline, i.e., the capacity of the economy to service debt has been exceeded and, not only is it impossible for the economy to grow at a rate sufficient to service existing debt (since interest compounds), but economic activity actually declines further as a function of additional debt.

A Downward Spiral

The process of debt deflation is straightforward. New lending at levels that would maintain or expand the broad money supply is impossible for two reasons: (1) asset values and incomes have fallen and millions remain unemployed; and (2) debt levels remain excessive compared to GDP, i.e., real economic activity (outside of the government and financial services industry) cannot service additional debt. The inability to lend, actually the result of prior excess lending, results in a net drain of money from the economy. The drain effect, in turn, leads to further defaults as cash strapped consumers and businesses fail to service existing debt, and as debt defaults impact bank balance sheets, putting a damper on new lending and completing the cycle of debt deflation.

Keynesian economic policies, i.e., government deficit spending, are irrelevant vis-à-vis excessive debt levels in the economy and bailing out banks is not a solution since it cannot stop the deterioration of their balance sheets. The process is self-perpetuating and cannot be stopped by any government or monetary policy because it is not a matter of policy, but rather one of mathematics.

Since the presence of excess debt (beyond what can be supported by a stable GDP, or by sustainable GDP growth) impacts the broad money supply, efforts to preserve bank balance sheets, i.e., to keep otherwise bad loans on the books of banks at full value, will ultimately cause bank balance sheets to deteriorate more than they would have otherwise. The fact that US banks issued trillions in bad loans cannot be corrected by changing accounting rules, nor can the consequences be avoided by government deficit spending or by unlimited bailouts, and the problem cannot be papered over by dropping freshly printed money from helicopters flying over Wall Street. The major problems facing the US economy today—a tsunami or debt defaults, structural unemployment, massive government budget deficits, a contraction of the broad money supply outside of the federal government and the financial system, and a lack of sustainable growth—cannot be addressed as long as excess debt levels are maintained. As von Mises clearly understood, sound economic conditions cannot be restored unless and until the excess debt, which resulted from a boom brought about by credit expansion, is purged from the system. The alternative, and the current policy of the United States, is a downward spiral into a bottomless economic abyss.

Related Links:

Togel178

Pedetogel

Sabatoto

Togel279

Togel158

Colok178

Novaslot88

Lain-Lain

Partner Links