Spain Spending its way into the Abyss

by Luis R. Miranda
The Real Agenda
March 9, 2012

The continuous rise in public spending in Spain is deeply braking the back of the country’s capacity to keep up with one of the most dire economic situations in the Euro zone. In the last 4 years, Spain has not been able to cope with one of the highest unemployment rates in the developed world. The outcome of the worldwide financial crisis that began in 2006 was not helped by the Spanish government’s socialist policies that are limited to increasing government spending in order to meet its obligations.

Spain's Prime Minister Mariano Rajoy

Much like the socialist government of Barack Obama in the United States, the Prime Minister’s office now headed by Mariano Rajoy, the leader of the Spanish People’s Party, continues to increase the burden known as the public debt. In a recent before the Spanish Congress, the Secretary of Labor, Fátima Bañez García, presented a new plan which seeks to perpetuate the status-quo: promote economic recovery and employment through a government led initiative that balloons public debt and sponsors policies that maintain the welfare state. This model doesn’t seem to work in countries where it was adopted, but for some reason, some European nations, including Spain, believe it is the way to go.

Given the lack of positive results, both the public and private sectors have begun to raise awareness about the unsustainable growth of the debt, which has shed no real solutions to the country’s out of control unemployment problem. Different from other countries in the region, Spain suffers from its skyrocketing 22% unemployment rate — according to official numbers. Depending on what sectors of the economy you look, this number grows even larger. €706 billion have not been enough of a stimulus for the Spanish economy to rebound, mostly because that money is not invested in growing sectors that were once the pillars of a stable nation. Incredibly, Spain’s public debt amounts to more than 60 percent of its gross domestic product — €1.07 trillion — much of which is spent in government operations and welfare programs that yield no significant results.

Currently, Spain’s public debt is larger than the number calculated by the European Union under its standards. Every year, the Spanish government adds mode debt to the deficit but the country does not produce enough to compensate for such spending. According to the Financial Times of London, in 2012 Spain will see an increase of its debt of €60 billion, which is equal to 6 per cent of the GDP. Despite the gigantic commitment made by Rajoy’s government, the amount of euros needed for Spain to keep up with its liabilities and entitlement programs overruns any attempt to overcome them. Meanwhile, the country will have to continue paying bank bailouts, contracts and financing the lives of the dependent classes which continue to rely on the government to get a job, food or any other form of support they need.

Although the government of Spain announced its intention of paying off billions of euros in overdue bills, interest rates on those unpaid bills may grow beyond the reach of the government’s possibilities. It is estimated that Spain’s public debt will soon amount to 87 percent of its GDP, leaving little or no room for error and very little time to implement more effective policies that bring about change to the economy. If the Spanish are not able to lift themselves out of their crisis, the country might need to follow the same path than Greece, which was forced by the European Union to accept financial aid in exchange for remaining as part of the bloc.

In the case of Greece, the infamous bank bailouts did not work, the debt was not liquidated and the country is in an even more dire situation today than it was before the bailouts. As a result of accepting the conditions imposed by the banks, which used the European governments as proxies to operate, Greece has renounced to its financial, economic and social sovereignty, but has not obtained any positive result. Whether Spain will follow in Greece’s steps it is not clear right now, but since the country has already accepted bailout money, it is likely this trend will continue as it happened with their European neighbors.

According to financial experts, Spain’s financial outlook does not look too good. The point of no return — although for many already here — seems to be when Spain’s obligations get to 90 percent of its GDP, a moment when experts say the country will find it difficult to maintain its house in order and to respect its own fiscal policies. As things are going today, some see Spain’s intention to cut its public debt to about 60 percent by 202o as an impossible task.

Incidentally, two of the main reasons why Spain fell into the financial hole it is now are the construction bubble, which exploded just previous to the beginning of the crisis — as it happened in the United States — as well as the adoption of a renewable energy subsidies program under the government of José Luis Zapatero. The program, according to a government report, returned zero euros from investments and instead created a hole in the employment market that cost 2.2 jobs for every job “created” by the state. In other words, for every job that was created by the green energy program sponsored by the Spanish government, the country lost 2.2 job positions.

The economic crisis and the Spanish government involvement in bailout programs that sought to rescue banks in that country made it so the public debt increased to 363 percent of the GDP in 2011.

As it often happens, once governments start to run out of options, they go to the last possible of them: corporate acquisition of public resources. That is, a massive transfer of money and property held by the government in representation of the people, to the hands of large corporations — mostly banks — which are the organizations responsible for the current global financial crisis, but that somehow found fertile land in government to ask for financial bailouts while charging those same governments interests on the money lent to them. In Greece, large corporations are now the owners of much of the country’s patrimony including its islands and major infrastructure. As the months go by and no solutions are presented by the Spanish government to reduce the impact of the ongoing economic depression, which include the liquidation of the debt, it is likely Spain will end giving away its financial and political sovereignty away, as well as handing out its infrastructure and resources to the banks, just as Greece did.

You may share our original content as long as you respect our copyright policy as shown on our website footer. Please don’t cut articles from The Real Agenda to redistribute by email or post to the web if you don’t follow our policies.

The Cycle of Debt Deflation

Before It’s News

One of the most famous quotations of Austrian economist Ludwig von Mises is that “There is no means of avoiding the final collapse of a boom brought about by credit expansion. The alternative is only whether the crisis should come sooner as the result of a voluntary abandonment of further credit expansion or later as a final and total catastrophe of the currency involved.” In fact, the US economy is in a downward spiral of debt deflation despite the bold actions of the federal government and of the US Federal Reserve taken in response to the financial crisis that began in 2008 and the associated recession. Although the vicious circle of debt deflation is not widely recognized, precisely what von Mises described is happening before our eyes.

A variety of positive economic data has been reported in recent months. Retail sales rose 0.4% in April 2010 as consumer spending rose and the US gross domestic product (GDP) grew at a rate of 3%.  In May 2010, home sales rose to a five-month high and consumer confidence rose 17% (from 57.7 to 63.3). Industrial production rose 0.8% and durable goods orders rose 2.9%, more than had been forecast. However, the modest gains reported represent the continuing adaptation of economic activity at dramatically lower levels compared to the pre-recession period and most of the reported gains have been substantially manufactured by massive government deficit spending.

Despite the widely reported green shoots, in May, the unemployment rate rose to 9.9% while paychecks in the private sector shrank to historic lows as a percentage of personal income, and personal bankruptcies rose. Roughly 14% of US mortgages are delinquent or in foreclosure, credit card defaults are rising and consumer spending hit 7 month lows. To make matters worse, the reported increase in consumer credit, in fact, points to a further deterioration because consumers appear to be borrowing to service existing debt. Outside of the federal government, which is borrowing at record levels and expanding as a percentage of GDP, and outside of the bailed out financial sector, debt deflation has continued unabated since 2008.

Money Supply vs. Debt Service

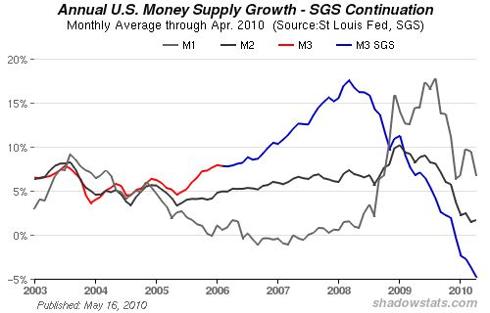
A contraction of the broad money supply is taking place because the influx of money into the US economy, i.e., lending to consumers and non financial businesses, has fallen below the rate at which money is flowing out of general circulation as a function of debt service (interest and principle payments on existing debt), thus a net drain of money from the broad US economy is taking place. As a result, additional borrowing, as consumer spending falls, appears to be servicing existing debt in a pattern that is clearly unsustainable and that signals a further rise in debt defaults in coming months.
M3
Chart courtesy of Shadow Government Statistics
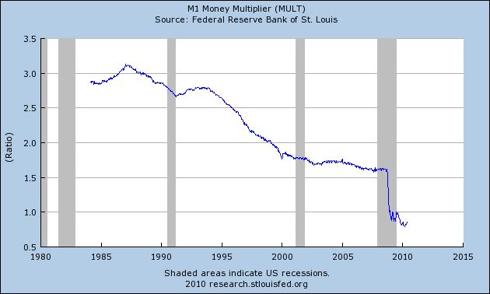
The estimate of the broad money supply (the Federal Reserve’s M3 monetary aggregate) is crashing and the Federal Reserve’s M1 Money Multiplier, a measure of how much new money is created through lending activity, fell off of a cliff in 2008, and remains practically flat-lined.
MULT
Chart courtesy of the Federal Reserve Bank of St. Louis
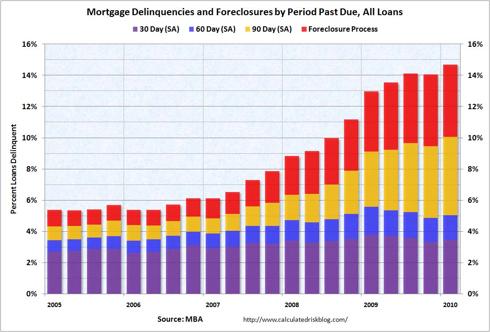
The contraction of the broad money supply points to a potential slowing of economic activity and indicates that consumers and non financial businesses will be less able to service existing debt. Despite easing somewhat in March 2010, credit card losses are expected to remain near 10% over the next year and mortgage delinquencies, are currently at a record highs, and these dismal predictions implicitly assume a stable or growing money supply.

A tsunami of eventual mortgage defaults seems to be building and loan modifications have been a failure thus far. There have been only a small number of permanent loan modifications (295,348) under the Home Affordable Modification Program (HAMP) in 2009, out of 3.3 million eligible (60 days delinquent) loans and more than half of modified loans default.

Mortgage Delinquencies and Foreclosures
Chart courtesy of Calculated Risk
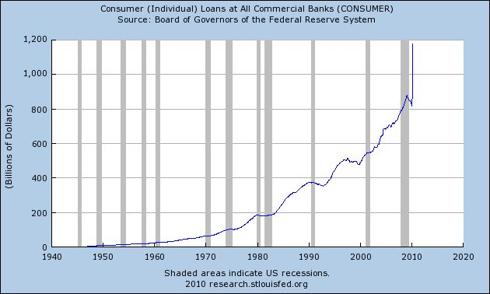
Although it has been reported that American consumers are saving at a rate of 3.4%, the contraction of the broad money supply suggests savings liquidation. Given a contracting money supply, ongoing debt defaults and declining consumer spending, the increase in non-mortgage consumer loans indicates that consumers are borrowing where possible to consolidate debts, cover debt service, or borrowing to continue operating financially as their total debt grows, thus as they approach insolvency.
CONSUMER
Chart courtesy of the Federal Reserve Bank of St. Louis
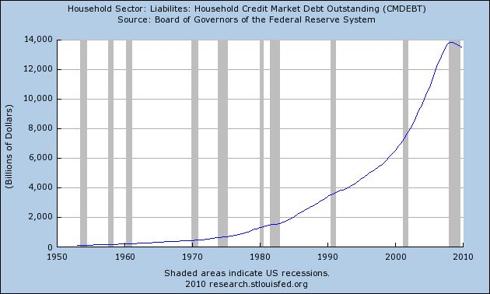
The increase in non-mortgage consumer loans has not prevented an overall decline in total household debt attributed to ongoing deleveraging by consumers. While deleveraging (paying down debt) has been interpreted as caution on the part of consumers, or as low consumer confidence, the decline in outstanding credit reflects a reduced ability to borrow, i.e., to service additional debt. This suggests that the recovery of the US economy may be illusory and that the economy is likely to contract further in coming months.
CMDEBT
Chart courtesy of the Federal Reserve Bank of St. Louis
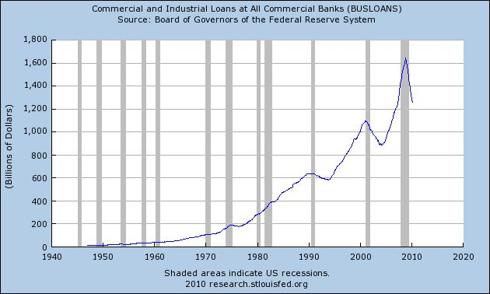
Commercial borrowing has declined more sharply than household debt suggesting that the nominal return to growth estimated at 3% has not been matched by debt financed expansion in the private sector.
BUSLOANS
Chart courtesy of the Federal Reserve Bank of St. Louis
The broad US money supply is no longer being maintained or expanded by normal lending activity. If federal government deficit spending ($1.5 trillion annually), debt monetization and emergency actions by the Federal Reserve (totaling an estimated $1.5 trillion since 2008) to recapitalize banks are considered separately, there remains a net drain effect on the broad money supply. The scarcity of money hampers economic activity, i.e., money is less available for investment, and directly exacerbates debt defaults as consumers and businesses experience cash shortfalls, while at the same time being less able to borrow. Since unemployment is a key indicator of recession, then if the US economy were contracting, it would be evident in unemployment statistics.

Structural Unemployment

Unemployment and labor force data suggest that the US labor market is in a structural decline, i.e., millions of jobs have been and are being permanently eliminated, perhaps as a long term consequence of off-shoring, outsourcing to other countries and the ongoing de-industrialization of the United States. However, the immediate meaning of the term “structural” has to with the fact that jobs created or sustained during the unprecedented expansion of debt leading to the financial crisis that began in 2008, e.g., a substantial portion of service sector jobs created in the past two decades now appear not to be viable outside of a credit expansion.

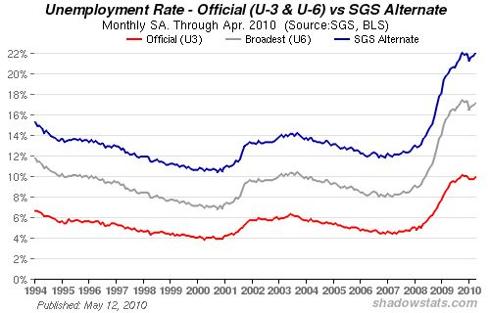
Officially, the US unemployment rate rose to 9.9% in April 2010, which represents the percentage of workers claiming unemployment benefits. However, the total number of unemployed or underemployed persons, including so-called “discouraged workers” (Bureau of Labor Statistics U-6), rose to 17.1%. Using the same methods that the BLS had used prior to the Clinton administration, U-6 would be approximately 22%, rather than the official 17.1% statistic.

U-6 Unemployment
Chart courtesy of Shadow Government Statistics
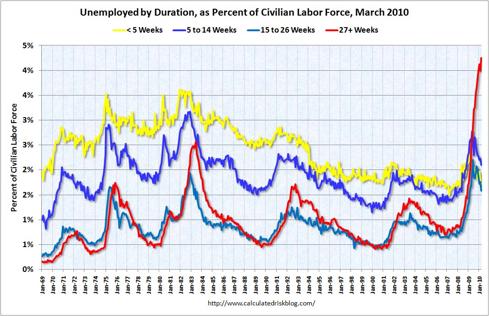
With official U-6 unemployment of 17.1% and a workforce of 154.1 million there are roughly 26,197,000 people officially out of work. Using the pre-Clinton U-6 unemployment calculation of approximately 22%, there would be 33.9 million unemployed. If the average US household consists of 2.6 persons and if 33% of the unemployed are sole wage earners, then 55.5 million US citizens currently have no means of financial support (17.9% of the population).
Unemployment by Duration
Chart courtesy of Calculated Risk
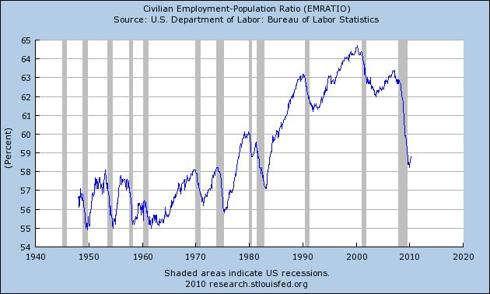
While it has been reported that the labor force is shrinking, the characterization of workers permanently exiting the workforce by choice may be inaccurate. While a shrinking workforce could reflect demographic changes, the rate of change suggests that tens of millions of Americans are simply unemployed.
EMRATIO
Chart courtesy of the Federal Reserve Bank of St. Louis
Setting aside the question of whether or not those “not in the workforce” are, in fact, permanently unemployed, the workforce, as a percentage of the total US population, is currently at 1970s levels. Since many more households today depend on two incomes to meet their obligations, compared to the 1970s, a marked drop in the percentage of the population in the workforce points to a decline in the labor market more significant than official unemployment statistics suggest. What is more important, however, is that structural unemployment suggests structural government deficits, e.g., unemployment benefits, welfare, food stamps, etc. Since more than 2/3 of US GDP (roughly 70%) consists of consumer spending, a sustainable recovery from recession seems improbable if unemployment is worsening or if the labor force is in a structural decline, since that would imply unsustainable government deficits, whether or not they are masked by nominal GDP gains thanks to economic stimulus measures.

Government and GDP Growth

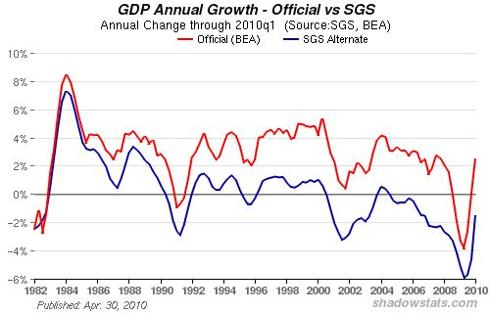
The US federal government is a growing portion of GDP, thus reported GDP growth is largely a byproduct of government deficit spending and stimulus measures, i.e., reported GDP growth is unsustainable. Total government spending at the local, state and federal levels accounts for as much as 45% of GDP, thus nominal gains would be expected when government deficit spending increases. According to some measures, reported gains in GDP are a byproduct of relatively new statistical methods and, using earlier methods of calculation, GDP remains negative.
GDP
Chart courtesy of Shadow Government Statistics
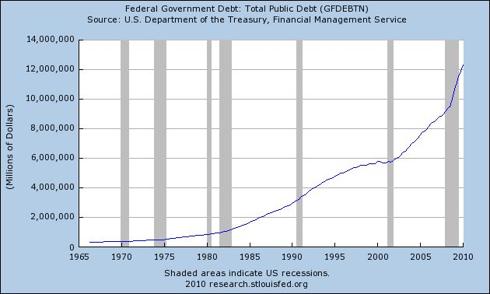
Government borrowing and spending may have offset declines in the private sector but only to a degree and only temporarily. The resulting growth in US public debt has an eventual mathematical limit: insolvency. Of course, the actual limit to US borrowing remains unknown. The continuing solvency of the US depends on the ability and willingness of governments, banks and investors around the world to lend to the US, which in turn depends on the tolerance of lenders for the US government’s profligacy and money printing by the Federal Reserve, e.g., quantitative easing and exchanging new cash for worthless bank assets. US Treasury bond auctions will fail if lenders conclude that a sufficiently large portion of their investment will be diluted into oblivion by proverbial money printing. In that event, the US dollar will surely plummet, despite deflationary pressures within the domestic US economy, and the cost of foreign goods, e.g., oil, will rise causing high inflation or triggering hyperinflation.
GFDEBTN
Chart courtesy of the Federal Reserve Bank of St. Louis
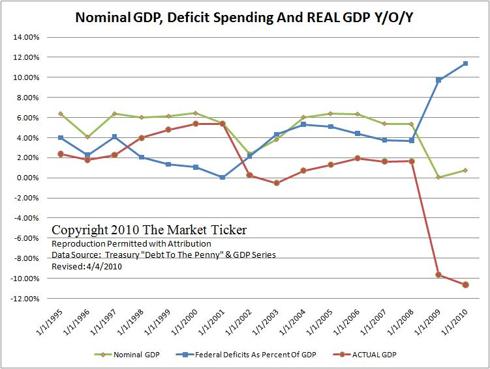
According to the Bank for International Settlements (BIS), the federal budget deficit increased from 3.1% of GDP in 2007 to 9.2% in 2010.  Rather than being the result of one-time expenses, such as temporary stimulus measures, much of the deficit represents permanent increases in government spending, e.g., due to the growing number of federal employees. If increased government spending is removed, GDP appears to be declining significantly.
GDP Minus Government Deficit Spending
Chart courtesy of Karl Denninger
Of course, sustainability has more to do with total debt than with deficit spending because a deficit assumes that there is an underlying capacity to service additional debt.

Unsustainable Debt

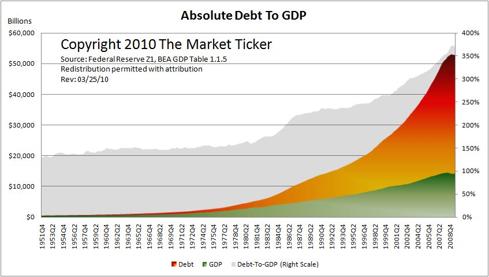
While asset prices have declined, e.g., real estate and equities, debt levels have remained high due to the federal government’s policy of preserving bank balance sheets, which had ballooned prior to the financial crisis to the point that overall debt in the US economy reached unsustainable levels.
Total Debt to GDP
Chart courtesy of Karl Denninger
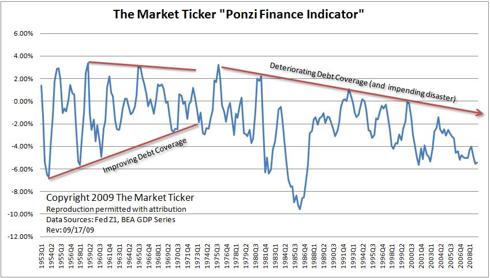
The absolute debt to GDP ratio of the US economy peaked in 2007 when debt levels exceeded the ability of the economy to service debt from income based on production, even at low interest rates. Although US GDP began to decline prior to the advent of the global financial crisis, debt coverage had been in decline approximately since the 1970s, coincidentally, around the time that the US dollar was decoupled from gold.
Declining Debt Coverage from 1971 on
Chart courtesy of Karl Denninger
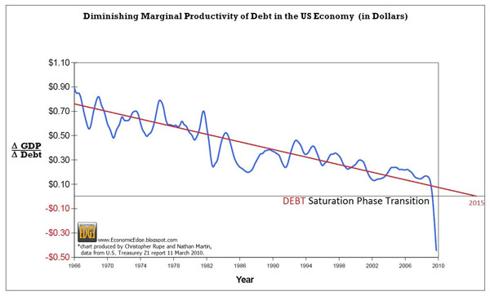
Government deficit spending cannot correct the situation because, for every dollar of new borrowing, the gain in GDP is negligible and some have argued that the US economy has passed the point of “debt saturation.”
Debt Saturation
Chart courtesy of Nathan A. Martin
In a growing economy, additional debt can result in a net gain in GDP because the money supply grows and economic activity is stimulated by transactions that flow through the economy as a result. The debt saturation hypothesis is that, as debt levels rise, additional debt has less impact on GDP until a point is reached where new debt causes GDP to decline, i.e., the capacity of the economy to service debt has been exceeded and, not only is it impossible for the economy to grow at a rate sufficient to service existing debt (since interest compounds), but economic activity actually declines further as a function of additional debt.

A Downward Spiral

The process of debt deflation is straightforward. New lending at levels that would maintain or expand the broad money supply is impossible for two reasons: (1) asset values and incomes have fallen and millions remain unemployed; and (2) debt levels remain excessive compared to GDP, i.e., real economic activity (outside of the government and financial services industry) cannot service additional debt. The inability to lend, actually the result of prior excess lending, results in a net drain of money from the economy. The drain effect, in turn, leads to further defaults as cash strapped consumers and businesses fail to service existing debt, and as debt defaults impact bank balance sheets, putting a damper on new lending and completing the cycle of debt deflation.

Keynesian economic policies, i.e., government deficit spending, are irrelevant vis-à-vis excessive debt levels in the economy and bailing out banks is not a solution since it cannot stop the deterioration of their balance sheets. The process is self-perpetuating and cannot be stopped by any government or monetary policy because it is not a matter of policy, but rather one of mathematics.

Since the presence of excess debt (beyond what can be supported by a stable GDP, or by sustainable GDP growth) impacts the broad money supply, efforts to preserve bank balance sheets, i.e., to keep otherwise bad loans on the books of banks at full value, will ultimately cause bank balance sheets to deteriorate more than they would have otherwise. The fact that US banks issued trillions in bad loans cannot be corrected by changing accounting rules, nor can the consequences be avoided by government deficit spending or by unlimited bailouts, and the problem cannot be papered over by dropping freshly printed money from helicopters flying over Wall Street. The major problems facing the US economy today—a tsunami or debt defaults, structural unemployment, massive government budget deficits, a contraction of the broad money supply outside of the federal government and the financial system, and a lack of sustainable growth—cannot be addressed as long as excess debt levels are maintained. As von Mises clearly understood, sound economic conditions cannot be restored unless and until the excess debt, which resulted from a boom brought about by credit expansion, is purged from the system. The alternative, and the current policy of the United States, is a downward spiral into a bottomless economic abyss.

Green Policies in Spain are a Total Failure

By Luis R. Miranda
The Real Agenda
May 19, 2010

Pajamas Media has received a leaked internal assessment produced by Spain’s Zapatero administration. The assessment confirms thspain's green economye key charges previously made by non-governmental Spanish experts in a damning report exposing the catastrophic economic failure of Spain’s “green economy” initiatives.

On eight separate occasions, President Barack Obama has referred to the “green economy” policies enacted by Spain as being the model for what he envisioned for America.

Later came the revelation that Obama administration senior Energy Department official Cathy Zoi — someone with serious publicized conflict of interest issues — demanded an urgent U.S. response to the damaging report from the non-governmental Spanish experts so as to protect the Obama administration’s plans.

Most recently, U.S. senators have introduced the vehicle for replicating Spain’s unfolding economic meltdown here, in the form of the “American Power Act.” For reasons that are obvious upon scrutiny, it should instead be called the American Power Grab Act.

But today’s leaked document reveals that even the socialist Spanish government now acknowledges the ruinous effects of green economic policy.

Unsurprisingly for a governmental take on a flagship program, the report takes pains to minimize the extent of the economic harm. Yet despite the soft-pedaling, the document reveals exactly why electricity rates “necessarily skyrocketed” in Spain, as did the public debt needed to underwrite the disaster. This internal assessment preceded the Zapatero administration’s recent acknowledgement that the “green economy” stunt must be abandoned, lest the experiment risk Spain becoming Greece.

The government report does not expressly confirm the highest-profile finding of the non-governmental report: that Spain’s “green economy” program cost the country 2.2 jobs for every job “created” by the state. However, the figures published in the government document indicate they arrived at a job-loss number even worse than the 2.2 figure from the independent study.

This document is not a public report. Spanish media has referred to its existence in recent weeks though, while Bloomberg and the Washington Examiner have noted the impact: Spain is now forced to jettison its plans — Obama’s model — for a “green economy.”

Remarkably, these items have received virtually no media attention.

An item which has been covered widely, however, is that President Obama is now pressuring Spain to turn off its spigot of public debt in the name of averting a situation similar to that of Greece.

Also covered widely is Obama’s promotion of the American Power Act — the legislation which would replicate Spain’s current situation in the United States.

Put simply, Obama is currently promoting a policy in the U.S. which is based on a policy that he wishes to see Spain abandon. Welcome to Obamaland, the particulars of which are explained in a fashion grandly more illuminating than this Obama-Zapatero dance in Power Grab: How Obama’s Green Policies Will Steal Your Freedom and Bankrupt America.

A translation of the leaked Zapatero government internal slide presentation: “Renewable Energy: Situation and Objectives April 2010”

1) Renewable Energy: Situation and Objectives April 2010

2) Renewable Energy Situation: The price of electricity affects household welfare

According to EuroStat data, the cost of electricity for households in Spain moved from below the European average to slightly above the average (+5% higher)

3) Renewable Energy Situation: The price of electricity determines the competitiveness of Spanish industry

Energy is a key input in industrial production processes. In basic industries (cement, industrial gases, metals, basic chemicals and steel), energy costs are three times the labor cost. The electrical cost for the Spanish industry is well above the European average (+17% higher).

4) Renewable Energy Situation: The price increase is mainly due to additional costs of renewables

The price of electricity determines the competitiveness of Spanish industry

Historical evolution of the prices of light and pool price [Appears above a graph showing a 77% price spike in industry's price for electricity]

A price increase cannot be explained by the evolution of electricity market price (pool), which has even fallen since 2005

5) Renewable Energy Situation: The price increase is mainly due to additional costs of renewables

The increase in the over-cost paid for renewable energy explains more than 120% of the variation of the electric bill, and has offset the reduction in production costs of conventional electricity (25%)

To these direct costs of renewables must be added indirect costs, as the need for additional investment in networks to integrate renewables (about 10% of planned investment in the planning) and capacity payments to the modular backup facilities (coal and gas) that are running a smaller number of hours

6) Situation of renewable energy: renewable energy has had a positive impact …

Thanks to the increase of renewable energies in the mix:

The rate of energy supply has increased by 3 points since 2005, to 23%, and the import of energy products has been reduced 5.500M Euro (including hydraulics).

Emissions have been reduced significantly, thanks primarily to the mix of electric generation being much cleaner (less than 120 tons of CO2 emissions per GWh of oil produced).

7) Situation of renewable energy: but its evolution in recent years has been too fast

From 2004-2010 the amount of premiums [over-cost paid for renewable energy; the subsidy] has increased fivefold. Only in 2009 it doubled over the previous year to reach 5.045M€, equivalent in amount to the entire public investment in R + D + i in Spain. [The renewables subsidy equaled the entire cost of producing electricity in Spain]. The forecast for 2010 is 6.300M€ (although 5.800M€ budgeted in January). This should add 1.000M€ for cogeneration.

With operational facilities, the renewable sector will receive in the next 25 years more than 126.000M€. In this factor, it adds a commitment to continue providing input to the renewable energies in the mix to meet the European objectives, which will increase this figure significantly.

8 ) Situation of renewable energy: Heterogeneity of renewables: costs

In 2009, the solar photovoltaic technology accounted for 53% of the extra cost of renewables, while they contributed only 11% of energy generated from these sources.

9) Situation of renewable energy: Heterogeneity of renewables: Impact on the external sector

Exports: Net exports of Spanish wind industry 1.300M€ contributed to the trade balance in 2008 and, besides, wind generation avoids fossil imports of 3.6M€.

Imports: By contrast, the PV industry growth was not gradual, hampering the formation of an auxiliary Spanish industry. In 2008 imports of photovoltaic cells and modules in Spain amounted to 5.182M€ (28.6% of net imports of crude and derivatives) as long around the 62% were imported.

10) Situation of renewable energy: Heterogeneity of renewables: Technical problems

Network Management. The proliferation of small plants and fluctuations in the availability of technologies hinder the management of the network.

11) Situation of renewable energy:

Regulatory mechanisms to support renewables have been:

– Pioneers in the world, which has allowed us to stay ahead of the industry, learn from the experience and finding some excesses.
There are numerous examples of these high returns: analyst reports, premiums accepted in other countries, over-subscription in the pre-records, facilities willing to accept lower premiums, “paper market” …

– Overly cautious about the ability of cost reduction technologies

– Inflexible, thereby preventing adjust remuneration to market signals and technological advancement

– Hardly told them by the administration in setting prices initially and have no control over the amounts … Which has caused a “bubble effect,” such as seen with photovoltaics in 2008 and the emergence of the thermal bubble (which would have continued in 2010 and successively had it not been for the pre-registration requirement imposed), as well as a sharp increase the over-costs [subsidies] paid to renewables in the form of a feed-in tariff.

12) Situation of renewable energy: Heterogeneity of renewables: International comparison

In wind power, our rates are in line with Europe. However, solar photovoltaics, Spanish retribution has been the most high, despite the higher number of hours of sun and more solar radiation.

Spain Wind € 75-84/MWh Solar €265/295/350/450/MWh

China Wind € 56-67 Solar € 121/MWh

Japan Wind € 73-89/MWh

Germany Wind € 92/MWh Solar € 287-395/MWh

France Wind € 82/MWh Solar €310-380

Italy Wind € 85/MWh Solar € 350-390

Poland Wind € 90/MWh

13) Situation of renewable energy: Recent technological developments

The investment costs of renewable energies mainly depend on its technological learning curve

The plots have experienced tremendous technological development in recent years, reducing their investment costs

Not being mature technologies, have much future room for improvement, which informs a decision to slow its current expansion

14) Situation of renewable energy: What have we done?

The Government has adapted the following initiatives:

– A new framework for PV in 2008 (RD1578/2008) that brings order to the pace of installation and marking signs ecstatic that transfer with May fast technological development gains to consumers

– Creation of a technology pre-registration for the remainder of May 2009 has allowed us to avoid the “bubble” that was generated in thermal and prevent the system being made even more untenable in 2010.

– Package of measures for the reduction to the tariff deficit with input from the traditional electric companies, consumers and government (without the contribution of renewable energy).

15) Situation of renewable energy: Difficulties in reducing the tariff deficit

– The Government is committed by law to eliminate by 2013 the tariff deficit

– Despite the evolution of the wholesale market (pool), the balance of certain items (the Iberian peninsula, nuclear waste) and higher light, the rate deficit was only slightly reduced.

16) Objectives

– Reaching 20% of final energy and 40% of electric generation from renewable sources by 2020.

– Reducing the deficit and preserve the competitiveness of industry and household welfare.

– Transfer gains in technological developments to consumers.

– Avoid speculation caused by excess profits, which damages its image and retards the construction of the plants pre-assigned (with an adverse effect on the industry).

– Mitigate the incentive for fraud that can generate the current differential between the rate and the price of the pool.

– Promote technological improvement and cost reduction, advancing the attainment of “grid parity,” which will allow greater installation of renewables until 2020.

Related Links:

Togel178

Pedetogel

Sabatoto

Togel279

Togel158

Colok178

Novaslot88

Lain-Lain

Partner Links