Globalists, Climate Alarmists Move Forward with Deindustrialization Agenda

Reuters
April 8, 2011

Rich and poor nations overcame deep divisions on Friday to cut a deal that maps out U.N. climate negotiations for 2011, building on last December’s agreement in Mexico and hardening the focus on tougher issues.

The deal in Bangkok came after nearly four days of talks that some developing nations said were needed to “recalibrate” U.N. climate negotiations after last year’s Cancun agreements.

They wanted an agenda that tackled the fate of the Kyoto Protocol on fighting global warming and rich countries’ pledges to cut emissions, and clarified sources of cash for poorer nations rather than just building on what was agreed at Cancun.

But many rich nations said some developing nations were simply trying to row back on what was agreed in Cancun and this undermined negotiations this year that culminate in the South African city of Durban from late November.

Many nations were unhappy that much of the April 3-8 meeting was taken up arguing over the agenda, with the United States saying the delay dampened the mood, while some developing nations had misgivings about the end result. All expressed an urgency to press ahead with negotiations.

“It’s less rosy today than when we came in (at the start of the meeting),” senior U.S. negotiator Jonathan Pershing told reporters. In particular, he said some countries wanted to renegotiate the Cancun decisions.

“I don’t think that’s going to be constructive. What became evident is that we can expect more of that going forward,” he said.

Tosi Mpanu Mpanu, chair of the Africa Group, said he had mixed feelings. “Thank god we came up with an agenda. It’s a pity it took so long. What does it say for the rest of the year?”

FRAUGHT

Cancun is widely regarded as saving the often fraught negotiations from collapse.

Nations agreed curbs on the loss of tropical forests, schemes to transfer clean technology to poorer nations and help them adapt to climate change impacts, and a goal for rich countries to provide $100 billion a year in aid from 2020.

But it side-stepped tougher issues, such as whether to extend or replace the Kyoto Protocol, with concerns growing that a new pact or extension to Kyoto will not be agreed before the pact’s first phase ends next year.

Kyoto binds almost 40 industrialized nations to cut greenhouse gas emissions by an average of 5.2 percent below 1990 levels during the five-year period 2008-2012. A second phase is meant to increase those cuts for rich nations.

It is the only pact imposing legal obligations on emissions cuts and the U.N. talks have been hobbled by disagreement over how to extend that obligation to all major economies, such as China, the world’s top greenhouse gas emitter.

The United States is No. 2. It never ratified Kyoto.

In Bangkok, there was a fresh focus on trying to find a compromise, with the agreed agenda stating there should be a continued discussion of the legal options of a new agreement that captures emissions curbs by all major economies.

“This evening in Bangkok, parties agreed an agenda to work toward a comprehensive and balanced outcome at the U.N. Climate Change Conference in Durban,” said U.N. climate chief Christiana Figueres.

But disputes still loom over the size of rich nations’ pledges to cut emissions, with the United Nations saying they are not enough to avoid average global warming of less than 2 degrees Celsius.

Nations agreed in Cancun to work to keep the rise below this level to stave off ever greater extremes of droughts and floods, crop failures and rising sea levels.

Environmental groups were worried by the outcome of Bangkok.

“Once again, delegates could not reach agreement over key issues, including the future of the Kyoto Protocol, bringing the talks to a screeching halt almost from the beginning,” said Tasneem Essop of WWF.

Others pointed to the urgency to act to fight the impacts of climate change.

“There’s uncertainty about where the Cancun agreements take us, and can countries meet their commitments, and is it enough? And I think that was really at the heart of the agenda debate,” said Angela Anderson of the U.S. Climate Action Network.

The Weather Isn’t Getting Weirder

The latest research belies the idea that storms are getting more extreme.

WSJ

By Anne Jolis

Last week a severe storm froze Dallas under a sheet of ice, just in time to disrupt the plans of the tens of thousands of (American) football fans descending on the city for the Super Bowl. On the other side of the globe, Cyclone Yasi slammed northeastern Australia, destroying homes and crops and displacing hundreds of thousands of people.

No evidence in this study suggests that larger storms, tropical or otherwise are caused by human activity and the emissions that come with it.


Some climate alarmists would have us believe that these storms are yet another baleful consequence of man-made CO2 emissions. In addition to the latest weather events, they also point to recent cyclones in Burma, last winter’s fatal chills in Nepal and Bangladesh, December’s blizzards in Britain, and every other drought, typhoon and unseasonable heat wave around the world.

But is it true? To answer that question, you need to understand whether recent weather trends are extreme by historical standards. The Twentieth Century Reanalysis Project is the latest attempt to find out, using super-computers to generate a dataset of global atmospheric circulation from 1871 to the present.

As it happens, the project’s initial findings, published last month, show no evidence of an intensifying weather trend. “In the climate models, the extremes get more extreme as we move into a doubled CO2 world in 100 years,” atmospheric scientist Gilbert Compo, one of the researchers on the project, tells me from his office at the University of Colorado, Boulder. “So we were surprised that none of the three major indices of climate variability that we used show a trend of increased circulation going back to 1871.”

In other words, researchers have yet to find evidence of more-extreme weather patterns over the period, contrary to what the models predict. “There’s no data-driven answer yet to the question of how human activity has affected extreme weather,” adds Roger Pielke Jr., another University of Colorado climate researcher.

We do know that carbon dioxide and other gases trap and re-radiate heat. We also know that humans have emitted ever-more of these gases since the Industrial Revolution. What we don’t know is exactly how sensitive the climate is to increases in these gases versus other possible factors—solar variability, oceanic currents, Pacific heating and cooling cycles, planets’ gravitational and magnetic oscillations, and so on.

Given the unknowns, it’s possible that even if we spend trillions of dollars, and forgo trillions more in future economic growth, to cut carbon emissions to pre-industrial levels, the climate will continue to change—as it always has.

That’s not to say we’re helpless. There is at least one climate lesson that we can draw from the recent weather: Whatever happens, prosperity and preparedness help. North Texas’s ice storm wreaked havoc and left hundreds of football fans stranded, cold, and angry. But thanks to modern infrastructure, 21st century health care, and stockpiles of magnesium chloride and snow plows, the storm caused no reported deaths and Dallas managed to host the big game on Sunday.

Compare that outcome to the 55 people who reportedly died of pneumonia, respiratory problems and other cold-related illnesses in Bangladesh and Nepal when temperatures dropped to just above freezing last winter. Even rich countries can be caught off guard: Witness the thousands stranded when Heathrow skimped on de-icing supplies and let five inches of snow ground flights for two days before Christmas. Britain’s GDP shrank by 0.5% in the fourth quarter of 2010, for which the Office of National Statistics mostly blames “the bad weather.”

Arguably, global warming was a factor in that case. Or at least the idea of global warming was. The London-based Global Warming Policy Foundation charges that British authorities are so committed to the notion that Britain’s future will be warmer that they have failed to plan for winter storms that have hit the country three years running.

A sliver of the billions that British taxpayers spend on trying to control their climes could have bought them more of the supplies that helped Dallas recover more quickly. And, with a fraction of that sliver of prosperity, more Bangladeshis and Nepalis could have acquired the antibiotics and respirators to survive their cold spell.

A comparison of cyclones Yasi and Nargis tells a similar story: As devastating as Yasi has been, Australia’s infrastructure, medicine, and emergency protocols meant the Category 5 storm has killed only one person so far. Australians are now mulling all the ways they could have better protected their property and economy.

But if they feel like counting their blessings, they need only look to the similar cyclone that hit the Irrawaddy Delta in 2008. Burma’s military regime hadn’t allowed for much of an economy before the cyclone, but Nargis destroyed nearly all the Delta had. Afterwards, the junta blocked foreign aid workers from delivering needed water purification and medical supplies. In the end, the government let Nargis kill more than 130,000 people.

Global-warming alarmists insist that economic activity is the problem, when the available evidence show it to be part of the solution. We may not be able to do anything about the weather, extreme or otherwise. But we can make sure we have the resources to deal with it when it comes.

Climate Sensitivity Reconsidered Part 1

A special report from Christopher Monckton of Brenchley for all Climate Alarmists, Consensus Theorists and Anthropogenic Global Warming Supporters

January 20, 2011

Abstract

The Intergovernmental Panel on Climate Change (IPCC, 2007) concluded that anthropogenic CO2 emissions probably
caused more than half of the “global warming” of the past 50 years and would cause further rapid warming. However,
global mean surface temperature TS has not risen since 1998 and may have fallen since late 2001. The present analysis
suggests that the failure of the IPCC’s models to predict this and many other climatic phenomena arises from defects in its
evaluation of the three factors whose product is climate sensitivity:

1) Radiative forcing ΔF;
2) The no-feedbacks climate sensitivity parameter κ; and
3) The feedback multiplier f.
Some reasons why the IPCC’s estimates may be excessive and unsafe are explained. More importantly, the conclusion is
that, perhaps, there is no “climate crisis”, and that currently-fashionable efforts by governments to reduce anthropogenic
CO2 emissions are pointless, may be ill-conceived, and could even be harmful.

The context

LOBALLY-AVERAGED land and sea surface absolute temperature TS has not risen since 1998 (Hadley Center; US National Climatic Data Center; University of Alabama at Huntsville; etc.). For almost seven years, TS may even have fallen (Figure 1). There may be no new peak until 2015 (Keenlyside et al., 2008).

The models heavily relied upon by the Intergovernmental Panel on Climate Change (IPCC) had not projected this multidecadal stasis in “global warming”; nor (until trained ex post facto) the fall in TS from 1940-1975; nor 50 years’ cooling in Antarctica (Doran et al., 2002) and the Arctic (Soon, 2005); nor the absence of ocean warming since 2003 (Lyman et al., 2006; Gouretski & Koltermann, 2007); nor the onset, duration, or intensity of the Madden-Julian intraseasonal oscillation, the Quasi-Biennial Oscillation in the tropical stratosphere, El Nino/La Nina oscillations, the Atlantic Multidecadal Oscillation, or the Pacific Decadal Oscillation that has recently transited from its warming to its cooling phase (oceanic oscillations which, on their own, may account for all of the observed warmings and coolings over the past half-century: Tsonis et al., 2007); nor the magnitude nor duration of multicentury events such as the Medieval Warm Period or the Little Ice Age; nor the cessation since 2000 of the previously-observed growth in atmospheric methane concentration (IPCC, 2007); nor the active 2004 hurricane season; nor the inactive subsequent seasons; nor the UK flooding of 2007 (the Met Office had forecast a summer of prolonged droughts only six weeks previously); nor the solar Grand Maximum of the past 70 years, during which the Sun was more active, for longer, than at almost any
similar period in the past 11,400 years (Hathaway, 2004; Solanki et al., 2005); nor the consequent surface “global warming” on Mars, Jupiter, Neptune’s largest moon, and even distant Pluto; nor the eerily- continuing 2006 solar minimum; nor the consequent, precipitate decline of ~0.8 °C in TS from January 2007 to May 2008 that has canceled out almost all of the observed warming of the 20th century.

Figure 1
Mean global surface temperature anomalies (°C), 2001-2008


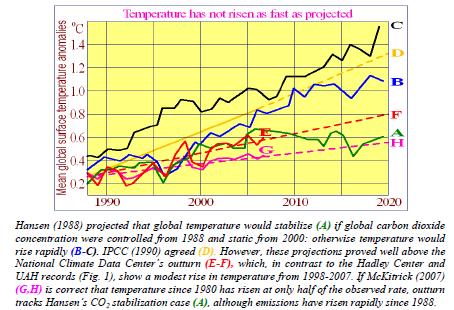
An early projection of the trend in TS in response to “global warming” was that of Hansen (1988), amplifying Hansen (1984) on quantification of climate sensitivity. In 1988, Hansen showed Congress a graph projecting rapid increases in TS to 2020 through “global warming” (Fig. 2):

Figure 2
Global temperature projections and outturns, 1988-2020

To what extent, then, has humankind warmed the world, and how much warmer will the world become if the current rate of increase in anthropogenic CO2 emissions continues? Estimating “climate sensitivity” – the magnitude of the change in TS after doubling CO2 concentration from the pre-industrial 278 parts per million to ~550 ppm – is the central question in the scientific debate about the climate. The official answer is given in IPCC (2007):

“It is very likely that anthropogenic greenhouse gas increases caused most of the observed increase in [TS] since the mid-20th century. … The equilibrium global average warming expected if carbon dioxide concentrations were to be sustained at 550 ppm is likely to be in the range 2-4.5 °C above pre-industrial values, with a best estimate of about 3 °C.”

Here as elsewhere the IPCC assigns a 90% confidence interval to “very likely”, rather than the customary 95% (two standard deviations). There is no good statistical basis for any such quantification, for the object to which it is applied is, in the formal sense, chaotic. The climate is “a complex, nonlinear, chaotic object” that defies long-run prediction of its future states (IPCC, 2001), unless the initial state of its millions of variables is known to a precision that is in practice unattainable, as Lorenz (1963; and see Giorgi, 2005) concluded in the celebrated paper that founded chaos theory –
“Prediction of the sufficiently distant future is impossible by any method, unless the present conditions are known exactly. In view of the inevitable inaccuracy and incompleteness of weather observations, precise, very-long-range weather forecasting would seem to be nonexistent.”  The Summary for Policymakers in IPCC (2007) says –“The CO2 radiative forcing increased by 20% in the last 10 years (1995-2005).”

Natural or anthropogenic CO2 in the atmosphere induces a “radiative forcing” ΔF, defined by IPCC (2001: ch.6.1) as a change in net (down minus up) radiant-energy flux at the tropopause in response to a perturbation. Aggregate forcing is natural (pre-1750) plus anthropogenic-era (post-1750) forcing. At 1990, aggregate forcing from CO2 concentration was ~27 W m–2 (Kiehl & Trenberth, 1997). From 1995-2005, CO2 concentration rose 5%, from 360 to 378 W m–2, with a consequent increase in aggregate forcing (from Eqn. 3 below) of ~0.26 W m–2, or <1%. That is one-twentieth of the value
stated by the IPCC. The absence of any definition of “radiative forcing” in the 2007 Summary led many to believe that the aggregate (as opposed to anthropogenic) effect of CO2 on TS had increased by 20% in 10 years. The IPCC – despite requests for correction – retained this confusing statement in its report.  Such solecisms throughout the IPCC’s assessment reports (including the insertion, after the scientists had completed their final draft, of a table in which four decimal points had been right-shifted so as to multiply tenfold the observed contribution of ice-sheets and glaciers to sea-level rise), combined with a heavy reliance upon computer models unskilled even in short-term projection, with initial values of key
variables unmeasurable and unknown, with advancement of multiple, untestable, non-Popperfalsifiable theories, with a quantitative assignment of unduly high statistical confidence levels to nonquantitative statements that are ineluctably subject to very large uncertainties, and, above all, with the now-prolonged failure of TS to rise as predicted (Figures 1, 2), raise questions about the reliability and hence policy-relevance of the IPCC’s central projections.

Dr. Rajendra Pachauri, chairman of the UN Intergovernmental Panel on Climate Change (IPCC), has recently said that the IPCC’s evaluation of climate sensitivity must now be revisited. This paper is a respectful contribution to that re-examination.

The IPCC’s method of evaluating climate sensitivity

We begin with an outline of the IPCC’s method of evaluating climate sensitivity. For clarity we will concentrate on central estimates. The IPCC defines climate sensitivity as equilibrium temperature change ΔTλ in response to all anthropogenic-era radiative forcings and consequent “temperature feedbacks” – further changes in TS that occur because TS has already changed in response to a forcing – arising in response to the doubling of pre-industrial CO2 concentration (expected later this century).  ΔTλ is, at its simplest, the product of three factors: the sum ΔF2x of all anthropogenic-era radiative forcings at CO2 doubling; the base or “no-feedbacks” climate sensitivity parameter κ; and the feedback
multiplier f, such that the final or “with-feedbacks” climate sensitivity parameter λ = κ f. Thus –

ΔTλ = ΔF2x κ f = ΔF2x λ, (1)
where f = (1 – bκ)–1, (2)

such that b is the sum of all climate-relevant temperature feedbacks. The definition of f in Eqn. (2) will be explained later. We now describe seriatim each of the three factors in ΔTλ: namely, ΔF2x, κ, and f.

1. Radiative forcing ΔFCO2, where (C/C0) is a proportionate increase in CO2 concentration, is given by several formulae in IPCC (2001, 2007). The simplest, following Myrhe (1998), is Eqn. (3) –

ΔFCO2 ≈ 5.35 ln(C/C0) ==> ΔF2xCO2 ≈ 5.35 ln 2 ≈ 3.708 W m–2. (3)

To ΔF2xCO2 is added the slightly net-negative sum of all other anthropogenic-era radiative forcings, calculated from IPCC values (Table 1), to obtain total anthropogenic-era radiative forcing ΔF2x at CO2 doubling (Eqn. 3). Note that forcings occurring in the anthropogenic era may not be anthropogenic.

Table 1
Evaluation of ΔF2x from the IPCC’s anthropogenic-era forcings
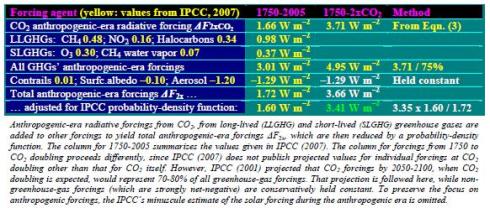

From the anthropogenic-era forcings summarized in Table 1, we obtain the first of the three factors –
ΔF2x ≈ 3.405 Wm–2. (4)

Continue to Part 2

Related Links:

Togel178

Pedetogel

Sabatoto

Togel279

Togel158

Colok178

Novaslot88

Lain-Lain

Partner Links