Planet Earth has been Cooling for 2000 years

By LUIS MIRANDA | THE REAL AGENDA | JULY 13, 2012

A study published on July 9 by Professor Dr Jan Esper of Johannes Gutenberg University in Mainz concludes that Earth, despite climate alarmism, has been cooling at least since 138BC, the time at which professor Esper began analyzing fossilized tree rings, which are considered one of the most accurate indicators of climate change.

The study also reinforces the theory that the Earth enjoys a climate that is always changing, that those changes occur over long periods of time — 2000 years – and that for any study to be taken seriously, it must contain data collected that represents such long periods. Smaller studies only measure the changes in climate that occurred during decades, or centuries, which in the realm of climate change are proven insignificant because they do not represent complete climate change trends.

The study conducted by a group of scientists led by Dr. Esper also explains other events such as how the Romans were able to plant grapes in northern England for a long time while the climate was warmer and how people later managed to walk on a frozen Thames river in London after the climate changed and became much colder.

“Our results suggest that the large-scale climate reconstruction shown by the Intergovernmental Panel on Climate Change (IPCC) likely underestimate this long-term cooling trend over the past few millennia,” says Professor Esper. The study sponsored by the Institute of Geography at JGU was published on the Journal Nature on July 8, and it was posted on the university’s website a day later. “Calculations prepared by Mainz scientists will also influence the way current climate change is perceived,” says the article on JGU’s page.

Over millennia, the Earth has gone through periods of climate change that have been labeled according to their peak events. For example, a global warming period occurred in times, under what is known as the Medieval Warm Period (MWP), Medieval Climate Optimum, or Medieval Climatic Anomaly. This period lasted from approximately 950 AD to 1250 AD. Later on, a cooler period followed mainly in the Northern Atlantic. This period was known as the Little Ice Age. The Little Ice Age was seen as a climate anomaly because of the impact it had on the region. That impact went beyond temperature swings.

What Professor Esper and his team of scientists from Germany, Finland, Scotland, and Switzerland did was to examine tree-ring density profiles in samples from Finnish Lapland. The remains of the trees were well preserved under very cold temperatures and due to the fact they had been at the bottom of numerous lakes, where they rested for thousands of years. The scientists used density measurements of the sub-fossil pine trees to create a sequence of climate change that went back to 138 BC. The measurements of the tree rings correlate very closely with temperatures in the region that is located on the Nordic taiga.

After obtaining the measurements, researchers reconstructed temperature records with great quality and fidelity, from which they produced a high-resolution presentation of temperature patterns throughout the last two millennia, including the Roman, Medieval and Migration periods, to arrive to the aforementioned Little Ice Age. The study performed by Dr. Esper also reveals a new phenomenon, that the study says, was not expected in this form. Researchers were able to use the data derived from tree-rings to precisely calculate a much longer-term cooling trend that has been playing out over the past 2,000 years.

“The findings of the study prove that such trend involves a cooling of -0.3°C per millennium due to gradual changes to the position of the sun and an increase in the distance between the Earth and the sun.” This fact reinforces the theory as well as previous studies and explanations from recognized climate scientists — such as Piers Corbyn — that solar activity and the movement of the Earth around the sun is much more of a driver of climate change and global warming than anthropogenic activity, as the IPCC, the University of East Anglia, Al Gore and James Hansen would have us believe.

“This figure we calculated may not seem particularly significant,” says Professor Esper. He adds that is also not negligible when compared to global warming, which up to now has been less than 1°C. According to the data obtained by the study, solar insolation changes that result from long-term oscillations of orbital configurations are a very important driver of Holocene climate. The influence of solar activity has been driving climate for the past 2,000 years, and its influence has been up to four times as strong as the 1.6 W m−2 net anthropogenic forcing since 1750.

“Here, we present new evidence based on maximum latewood density data from northern Scandinavia, indicating that this cooling trend was stronger (−0.31 °C per 1,000 years, ±0.03 °C) than previously reported, and demonstrate that this signature is missing in published tree-ring proxy records. The long-term trend now revealed in maximum latewood density data is in line with coupled general circulation models indicating albedo-driven feedback mechanisms and substantial summer cooling over the past two millennia in northern boreal and Arctic latitudes. These findings, together with the missing orbital signature in published dendrochronological records, suggest that large-scale near-surface air-temperature reconstructions relying on tree-ring data may underestimate pre-instrumental temperatures including warmth during Medieval and Roman times.”

Dr. Esper and his colleagues believe that over the last 2 millennia, Earths orbital forcing continually reduced summer insolation in the Northern Hemisphere. Most of the changes experienced on the planet due to such orbital changes, they say, were mostly felt at latitudes of ~65° N in the Northern Hemisphere, between June–August (JJA). Those same forces have been found to drive climate variability over the past million years. Interestingly, Johannes Gutenberg University Mainz’s study also incorporates the influence of long-term CO2 emissions in the results, and determined that orbital forcings together with climate variability resulting from biogeochemical feedbacks from the marine and terrestrial ecosystems, is what initiated the cooling cycles between glacial and interglacial periods.

The unreliability of shorter-term tree ring measurements due to their limited capacity to evaluate low-frequency temperature fluctuations was dealt with by developing a 2,000-year summer temperature reconstruction based on 587 high-precision maximum latewood density (MXD) series from northern Scandinavia. This reconstruction was based on a three-year analysis of living and subfossil pine (Pinus sylvestris) trees from 14 lakes and 3 lakeshore sites at latitudes of or near 65° N. The methodology permitted the scientists to obtain much better replicated than any existing MXD time series.

“We carried out a number of tests to the MXD network and noted the robustness of the long-term trends, but also the importance of including living trees from the lakeshore to form a seamless transition to the subfossil material preserved in the lakes. Calibration/verification with instrumental data is temporally robust and no evidence for divergence was noted,” says the study. Once the data was accepted as part of the study, the last reconstruction (N-scan) was calibrated against regional JJA temperature (r1876–2006 = 0.77) and spans the 138 BC–AD 2006 period.

This latest study from Johannes Gutenberg University Mainz is strong proof that all attempts to use climate change, global warming or human activity as escapegoats for governments and international organizations such as the United Nations to take over the resources of the planet and limit development are all about the advancement of a corporate controlled agenda that dies a little bit more every day.

Perhaps New York Mayor Michael Bloomberg should be sent this study and its results so he stops thinking about caging people in japanese-style apartments that look more like prisons than homes. The study should also be a wake-up call for James Hansen, Al Gore, Ted Turner and Bill Gates that the people understand that their dream to take civilization back to pre-industrial ages’ living standards is not going to happen. It will certainly be an arrow through the heart of the United Nations Agenda 21 policies that are now being implemented all over the planet because, the UN says, ‘we must save the planet’ from anthropogenic global warming.

Can they all argue with such a conclusive 2000 year old climate record study? They can try.

The Death Of Global Warming Skepticism, Or The Birth Of Straw Men?

by James Taylor
Forbes
October 26, 2011

The mainstream media has been spiking the football in the proverbial end zone ever since a paper released last Friday claimed two-thirds of global temperature stations show some warming occurred during the past century. The media have been claiming the new paper delivers a death blow to skepticism, but the paper itself brings almost nothing new to the global warming debate and instead shows how far global warming advocates are from presenting credible evidence of a crisis. Rather than delivering a death blow to skepticism, the media has merely invented and shredded an insignificant straw man.

University of California, Berkeley physics professor Richard Muller analyzed land-based temperature readings from temperature stations around the world and found two-thirds indicate warming temperatures and one-third indicate cooling temperatures. As a result, “Global warming is real,” summarized Muller in an editorial he wrote in the October 21 Wall Street Journal .

Muller acknowledged that many of the stations produced incomplete temperature records and had poor quality control. He claimed that he nevertheless included them in the study to avoid “data-selection bias.” Scientists such as Anthony Watts have pointed out several additional flaws in the Muller paper. But let’s assume, for the sake of argument, that Muller’s paper is flawless in its conclusion that two-thirds of land-based temperature stations report warming rather than cooling. Even under such an assumption, Muller’s paper does nothing to dispel skeptical objections to the theory that humans are causing a global warming crisis.

The case for a human-induced global warming crisis requires the demonstration of several components. These include (1) that global temperatures are rising, (2) that global temperatures will likely continue to rise in the future, (3) that the rise in temperatures is or will be sufficiently rapid and substantial to cause enormous negative consequences that far outweigh the benefits of such warming and (4) that human emissions of greenhouse gases account for all such temperature rise or enough of the temperature rise to elevate the temperature rise to crisis levels.

In order to justify government action against global warming, advocates must also show that the proposed action will substantially reduce the negative impacts of the asserted crisis and that the costs of such action will not outweigh the benefits.

Muller’s paper merely addresses the first component necessary to support the theory of a human-induced global warming crisis. Moreover, this first component hasn’t been in dispute, even before publication of Muller’s paper.

Very few if any skeptics assert that the earth is still in the Little Ice Age. While the Little Ice Age raged from approximately 1300 to 1900 AD, it is pretty well accepted that the Little Ice Age did indeed end by approximately 1900 AD. The mere fact that the Little Ice Age ended a little over 100 years ago, and that temperatures have warmed during the course of recovering from the Little Ice Age, tells us absolutely nothing about the remaining components necessary to support an assertion that humans are creating a global warming crisis.

Muller himself admits, “How much of the warming is due to humans and what will be the likely effects? We made no independent assessment of that.”

So we have a paper merely claiming that two out of three global temperature stations report the Little Ice Age is over. This supports the media spiking the football and proclaiming the death of skepticism regarding a human-induced global warming crisis?

Even prominent global warming advocate Eric Steig admits, “Anybody expecting earthshaking news from Berkeley, now that the Berkeley Earth Surface Temperature group being led by Richard Muller has released its results, had to be content with a barely perceptible quiver. As far as the basic science goes, the results could not have been less surprising if the press release had said ‘Man Finds Sun Rises At Dawn.’”

“Overall, we are underwhelmed by the quality of [the] Berkeley effort so far,” Steig adds.

Far from marking the death of skepticism, the media’s over-the-top sensationalism of the Muller paper shows just how far global warming advocates are from supporting their assertions of a human-induced global warming crisis. The straw man may be dead, but skepticism of a human-induced global warming crisis is alive and well.

Climate Sensitivity Reconsidered Part 1

A special report from Christopher Monckton of Brenchley for all Climate Alarmists, Consensus Theorists and Anthropogenic Global Warming Supporters

January 20, 2011

Abstract

The Intergovernmental Panel on Climate Change (IPCC, 2007) concluded that anthropogenic CO2 emissions probably
caused more than half of the “global warming” of the past 50 years and would cause further rapid warming. However,
global mean surface temperature TS has not risen since 1998 and may have fallen since late 2001. The present analysis
suggests that the failure of the IPCC’s models to predict this and many other climatic phenomena arises from defects in its
evaluation of the three factors whose product is climate sensitivity:

1) Radiative forcing ΔF;
2) The no-feedbacks climate sensitivity parameter κ; and
3) The feedback multiplier f.
Some reasons why the IPCC’s estimates may be excessive and unsafe are explained. More importantly, the conclusion is
that, perhaps, there is no “climate crisis”, and that currently-fashionable efforts by governments to reduce anthropogenic
CO2 emissions are pointless, may be ill-conceived, and could even be harmful.

The context

LOBALLY-AVERAGED land and sea surface absolute temperature TS has not risen since 1998 (Hadley Center; US National Climatic Data Center; University of Alabama at Huntsville; etc.). For almost seven years, TS may even have fallen (Figure 1). There may be no new peak until 2015 (Keenlyside et al., 2008).

The models heavily relied upon by the Intergovernmental Panel on Climate Change (IPCC) had not projected this multidecadal stasis in “global warming”; nor (until trained ex post facto) the fall in TS from 1940-1975; nor 50 years’ cooling in Antarctica (Doran et al., 2002) and the Arctic (Soon, 2005); nor the absence of ocean warming since 2003 (Lyman et al., 2006; Gouretski & Koltermann, 2007); nor the onset, duration, or intensity of the Madden-Julian intraseasonal oscillation, the Quasi-Biennial Oscillation in the tropical stratosphere, El Nino/La Nina oscillations, the Atlantic Multidecadal Oscillation, or the Pacific Decadal Oscillation that has recently transited from its warming to its cooling phase (oceanic oscillations which, on their own, may account for all of the observed warmings and coolings over the past half-century: Tsonis et al., 2007); nor the magnitude nor duration of multicentury events such as the Medieval Warm Period or the Little Ice Age; nor the cessation since 2000 of the previously-observed growth in atmospheric methane concentration (IPCC, 2007); nor the active 2004 hurricane season; nor the inactive subsequent seasons; nor the UK flooding of 2007 (the Met Office had forecast a summer of prolonged droughts only six weeks previously); nor the solar Grand Maximum of the past 70 years, during which the Sun was more active, for longer, than at almost any
similar period in the past 11,400 years (Hathaway, 2004; Solanki et al., 2005); nor the consequent surface “global warming” on Mars, Jupiter, Neptune’s largest moon, and even distant Pluto; nor the eerily- continuing 2006 solar minimum; nor the consequent, precipitate decline of ~0.8 °C in TS from January 2007 to May 2008 that has canceled out almost all of the observed warming of the 20th century.

Figure 1
Mean global surface temperature anomalies (°C), 2001-2008


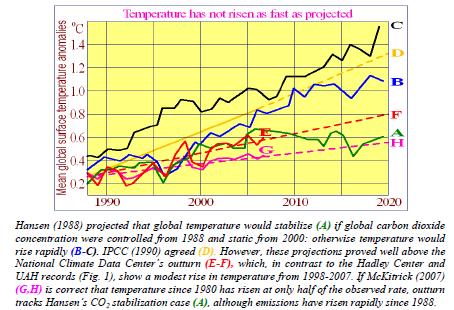
An early projection of the trend in TS in response to “global warming” was that of Hansen (1988), amplifying Hansen (1984) on quantification of climate sensitivity. In 1988, Hansen showed Congress a graph projecting rapid increases in TS to 2020 through “global warming” (Fig. 2):

Figure 2
Global temperature projections and outturns, 1988-2020


To what extent, then, has humankind warmed the world, and how much warmer will the world become if the current rate of increase in anthropogenic CO2 emissions continues? Estimating “climate sensitivity” – the magnitude of the change in TS after doubling CO2 concentration from the pre-industrial 278 parts per million to ~550 ppm – is the central question in the scientific debate about the climate. The official answer is given in IPCC (2007):

“It is very likely that anthropogenic greenhouse gas increases caused most of the observed increase in [TS] since the mid-20th century. … The equilibrium global average warming expected if carbon dioxide concentrations were to be sustained at 550 ppm is likely to be in the range 2-4.5 °C above pre-industrial values, with a best estimate of about 3 °C.”

Here as elsewhere the IPCC assigns a 90% confidence interval to “very likely”, rather than the customary 95% (two standard deviations). There is no good statistical basis for any such quantification, for the object to which it is applied is, in the formal sense, chaotic. The climate is “a complex, nonlinear, chaotic object” that defies long-run prediction of its future states (IPCC, 2001), unless the initial state of its millions of variables is known to a precision that is in practice unattainable, as Lorenz (1963; and see Giorgi, 2005) concluded in the celebrated paper that founded chaos theory –
“Prediction of the sufficiently distant future is impossible by any method, unless the present conditions are known exactly. In view of the inevitable inaccuracy and incompleteness of weather observations, precise, very-long-range weather forecasting would seem to be nonexistent.”  The Summary for Policymakers in IPCC (2007) says –“The CO2 radiative forcing increased by 20% in the last 10 years (1995-2005).”

Natural or anthropogenic CO2 in the atmosphere induces a “radiative forcing” ΔF, defined by IPCC (2001: ch.6.1) as a change in net (down minus up) radiant-energy flux at the tropopause in response to a perturbation. Aggregate forcing is natural (pre-1750) plus anthropogenic-era (post-1750) forcing. At 1990, aggregate forcing from CO2 concentration was ~27 W m–2 (Kiehl & Trenberth, 1997). From 1995-2005, CO2 concentration rose 5%, from 360 to 378 W m–2, with a consequent increase in aggregate forcing (from Eqn. 3 below) of ~0.26 W m–2, or <1%. That is one-twentieth of the value
stated by the IPCC. The absence of any definition of “radiative forcing” in the 2007 Summary led many to believe that the aggregate (as opposed to anthropogenic) effect of CO2 on TS had increased by 20% in 10 years. The IPCC – despite requests for correction – retained this confusing statement in its report.  Such solecisms throughout the IPCC’s assessment reports (including the insertion, after the scientists had completed their final draft, of a table in which four decimal points had been right-shifted so as to multiply tenfold the observed contribution of ice-sheets and glaciers to sea-level rise), combined with a heavy reliance upon computer models unskilled even in short-term projection, with initial values of key
variables unmeasurable and unknown, with advancement of multiple, untestable, non-Popperfalsifiable theories, with a quantitative assignment of unduly high statistical confidence levels to nonquantitative statements that are ineluctably subject to very large uncertainties, and, above all, with the now-prolonged failure of TS to rise as predicted (Figures 1, 2), raise questions about the reliability and hence policy-relevance of the IPCC’s central projections.

Dr. Rajendra Pachauri, chairman of the UN Intergovernmental Panel on Climate Change (IPCC), has recently said that the IPCC’s evaluation of climate sensitivity must now be revisited. This paper is a respectful contribution to that re-examination.

The IPCC’s method of evaluating climate sensitivity

We begin with an outline of the IPCC’s method of evaluating climate sensitivity. For clarity we will concentrate on central estimates. The IPCC defines climate sensitivity as equilibrium temperature change ΔTλ in response to all anthropogenic-era radiative forcings and consequent “temperature feedbacks” – further changes in TS that occur because TS has already changed in response to a forcing – arising in response to the doubling of pre-industrial CO2 concentration (expected later this century).  ΔTλ is, at its simplest, the product of three factors: the sum ΔF2x of all anthropogenic-era radiative forcings at CO2 doubling; the base or “no-feedbacks” climate sensitivity parameter κ; and the feedback
multiplier f, such that the final or “with-feedbacks” climate sensitivity parameter λ = κ f. Thus –

ΔTλ = ΔF2x κ f = ΔF2x λ, (1)
where f = (1 – bκ)–1, (2)

such that b is the sum of all climate-relevant temperature feedbacks. The definition of f in Eqn. (2) will be explained later. We now describe seriatim each of the three factors in ΔTλ: namely, ΔF2x, κ, and f.

1. Radiative forcing ΔFCO2, where (C/C0) is a proportionate increase in CO2 concentration, is given by several formulae in IPCC (2001, 2007). The simplest, following Myrhe (1998), is Eqn. (3) –

ΔFCO2 ≈ 5.35 ln(C/C0) ==> ΔF2xCO2 ≈ 5.35 ln 2 ≈ 3.708 W m–2. (3)

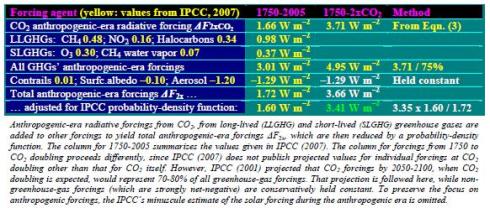
To ΔF2xCO2 is added the slightly net-negative sum of all other anthropogenic-era radiative forcings, calculated from IPCC values (Table 1), to obtain total anthropogenic-era radiative forcing ΔF2x at CO2 doubling (Eqn. 3). Note that forcings occurring in the anthropogenic era may not be anthropogenic.

Table 1
Evaluation of ΔF2x from the IPCC’s anthropogenic-era forcings


From the anthropogenic-era forcings summarized in Table 1, we obtain the first of the three factors –
ΔF2x ≈ 3.405 Wm–2. (4)

Continue to Part 2

Daftar Akun Bandar Togel Resmi dengan Hadiah 4D 10 Juta Tahun 2024

Togel resmi adalah langkah penting bagi para penggemar togel yang ingin menikmati permainan dengan aman dan terpercaya. Tahun 2024 menawarkan berbagai kesempatan menarik, termasuk hadiah 4D sebesar 10 juta rupiah yang bisa Anda menangkan. Anda perlu mendaftar akun di Daftar Togel yang menawarkan hadiah tersebut. Proses pendaftaran biasanya sederhana dan melibatkan pengisian formulir dengan informasi pribadi Anda serta verifikasi data untuk memastikan keamanan transaksi. Setelah akun Anda selasai terdaftar, Anda dapat berpartisipasi dalam berbagai permainan togel berbagai fitur yang disediakan oleh situs togel terbesar.

Bermain di Link Togel memungkinkan Anda memasang taruhan dengan minimal 100 perak, sehingga semua kalangan bisa ikut serta. Meskipun taruhan rendah, Anda tetap bisa memenangkan hadiah besar dan mendapatkan bonus. Untuk mulai bermain, Anda harus mendaftar terlebih dahulu.

Bagi pemain togel yang ingin menikmati diskon terbesar, mendaftar di situs togel online terpercaya adalah langkah yang tepat. Bo Togel Hadiah 2d 200rb tidak hanya memberikan jaminan keamanan dalam bertransaksi, tetapi juga menawarkan berbagai diskon untuk jenis taruhan tertentu. Diskon yang besar ini memungkinkan pemain untuk menghemat lebih banyak dan memasang taruhan dalam jumlah yang lebih banyak. Dengan begitu, peluang untuk mendapatkan hadiah juga semakin tinggi, sekaligus memastikan bahwa setiap taruhan dilakukan di situs yang aman dan resmi.

Link Slot Gacor Terpercaya untuk Menang Setiap Hari

Slot gacor hari ini menjadi incaran para pemain Link Slot Gacor yang ingin menikmati peluang jackpot besar hanya dengan menggunakan modal kecil, sehingga mereka bisa merasakan pengalaman bermain yang lebih menyenangkan dan penuh keuntungan.

Situs dengan slot Mahjong Ways gacor memberikan jackpot dan Scatter Hitam lebih sering di tahun 2024. Pastikan memilih situs terpercaya yang menyediakan fitur scatter unggulan, sehingga peluang Anda untuk menang lebih besar dan aman.

Dengan Situs Slot Depo 5k, Anda bisa bermain dengan modal kecil namun tetap memiliki kesempatan besar untuk meraih hadiah. Banyak platform judi online kini menawarkan pilihan deposit rendah ini, sehingga pemain dengan budget terbatas tetap bisa menikmati permainan slot favorit mereka. Bermain slot dengan deposit kecil seperti ini tentu memberikan kenyamanan bagi pemain baru maupun veteran.

Situs Slot Gacor Gampang Menang RTP Live Tertinggi

Strategi bermain slot online kini semakin berkembang, terutama dengan munculnya data rtp slot gacor tertinggi. Para pemain dapat memanfaatkan rtp live untuk memilih slot gacor dengan rtp slot yang terbaik, memastikan mereka memiliki peluang menang yang lebih besar. Slot rtp tertinggi yang tersedia hari ini bisa menjadi panduan penting bagi siapa saja yang ingin menikmati permainan yang lebih menguntungkan. Dengan memahami rtp slot online, pemain dapat bermain dengan lebih strategis dan mendapatkan hasil yang lebih memuaskan.

Related Links:

Togel178

Pedetogel

Sabatoto

Togel279

Togel158

Colok178

Novaslot88

Lain-Lain

Partner Links